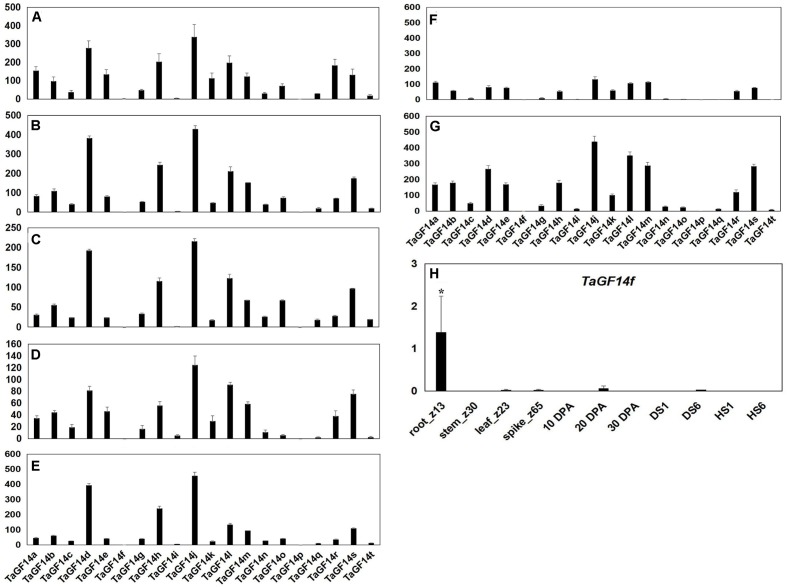
FIGURE 3.
Detection of TaGF14 transcripts by silicon expression profiles. (A) Root_Z13. (B) Stem_Z30. (C) Leaf_Z23. (D) Spike_Z65. (E) Developing grains_10 DPA. (F) Developing grains_20 DPA. (G) Developing grains_30 DPA. Bar represents the standard error. (H) The expression of TaGF14f was displayed in different tissues. ∗At the top of each column indicates significant difference at P = 0.05.

