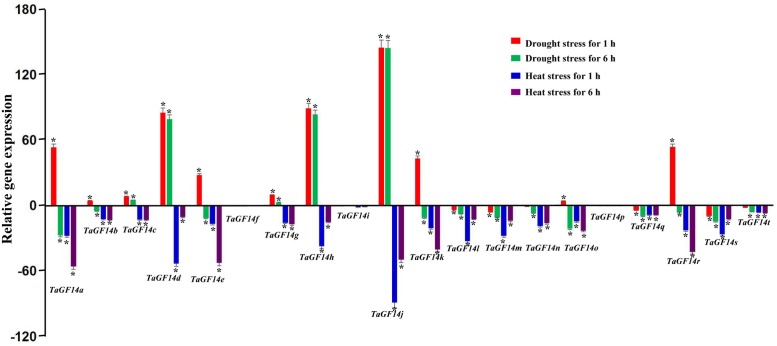
FIGURE 4.
Wheat TaGF14s expression induced by drought and heat. Red, green, blue, and purple column represent drought stress for 1 h, drought stress for 6 h, heat stress for 1 h, and heat stress for 6 h. Bar represents the standard error. ∗At the top of each column indicates significant difference at P = 0.05.

