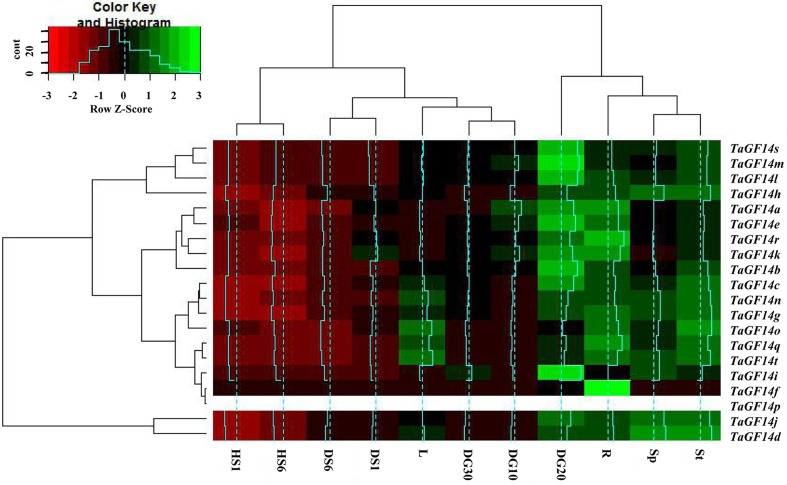
FIGURE 5.
Heatmap of TaGF14s drawn with software R program (gplot) based on its expression data in different tissues or samples treated with drought and heat stresses. St, Stem_Z30. Sp, Spike_Z65. R, Root_Z13. L, Leaf_Z23. DG10, Developing grains_10 DPA. DG20, Developing grains_20 DPA. DG30, Developing grains_30 DPA.

