
Figure 5.
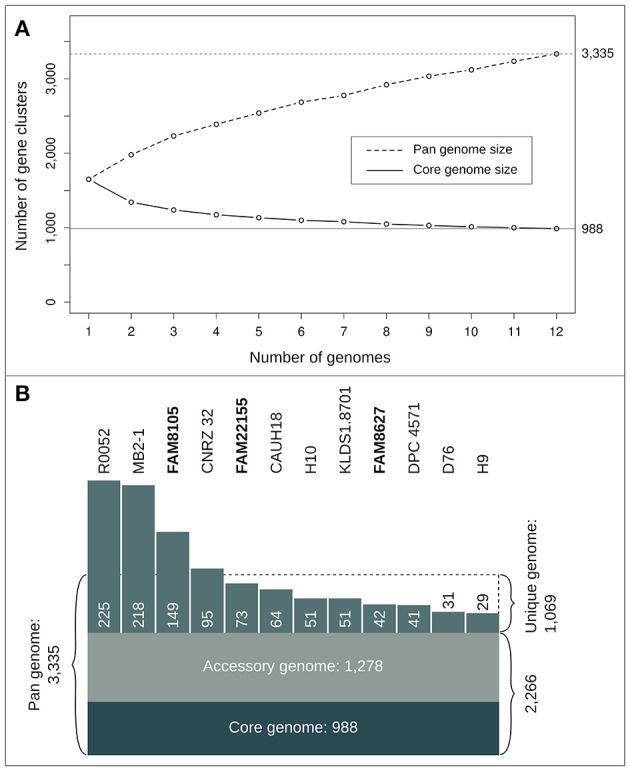
Statistics of the L. helveticus pan- and core genome based on 12 completely sequenced strains. (A) Number of gene clusters for pan (dashed line) and core genome profile (straight line) when successively adding genomes. The curves show mean values of 10 iterations where genomes were randomly added and the pan and core genome was calculated successively for all 12 steps. (B) Number of gene clusters (reflected by the size of the respective areas) for core, accessory, pan and unique genome.