
Figure 2.
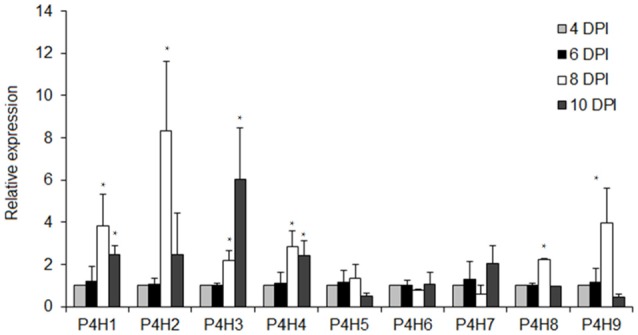
Expression analysis of nine tomato prolyl 4 hydroxylases in different tomato seedling stages of 4, 6, 8, and 10 DPI (Days Post Imbibition). Relative expression was calculated based on the comparative Ct method using actin as internal standard. The Ct value for each gene was normalized to the Ct value for actin and was calculated relative to a calibrator (4 DPI) using the formula 2−DDCt. Vertical bars are the average S.E. of three biological replicates. The *indicates significant difference in the gene's relative expression.