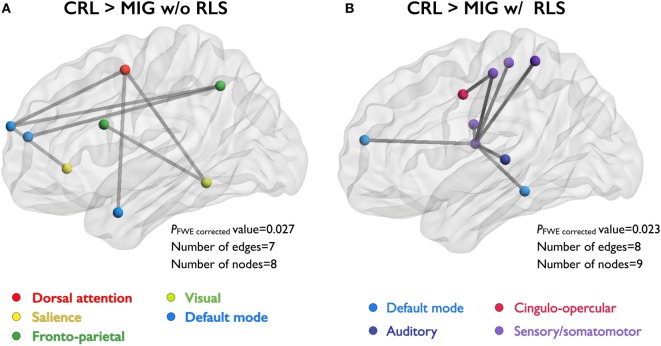
Figure 2.
NBS identify the set of abnormal functional connections between study groups. Illustration of the network with reduced FC in two patient groups (compared to CRL group). Node colors correspond with the different functional subsystems. (A) Compared to CRL, MIG w/o RLS showed reduced FC in the network with eight nodes and seven edges, and (B) MIG w RLS showed reduced FC in the network with nine nodes and eight edges. Abbreviations: CRL, healthy controls; FC, functional connectivity; MIG w/o RLS, migraine without restless legs syndrome; MIG w RLS, migraine with restless legs syndrome; NBS, network-based statistics; FWE, family-wise error.

