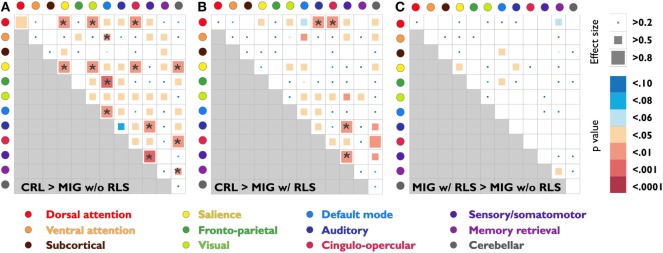
Figure 3.
Statistical analysis and effect size estimation of composite z-score FC matrices among three study groups (A)–(C). Circles with different colors represent 12 functional subsystems. Inside the matrices, the squares with different colors indicate seven statistical levels of matrixwise comparisons between study groups (uncorrected p-values); the squares with different sizes indicate the corresponding effect size, which was calculated by Cohen’s d. The asterisk indicates that the p-value is less than the FDR corrected p-value 0.05. Abbreviations: CRL, healthy controls; FC, functional connectivity; FDR, false discovery rate; MIG w/o RLS, migraine without restless legs syndrome; MIG w/RLS, migraine with restless legs syndrome.

