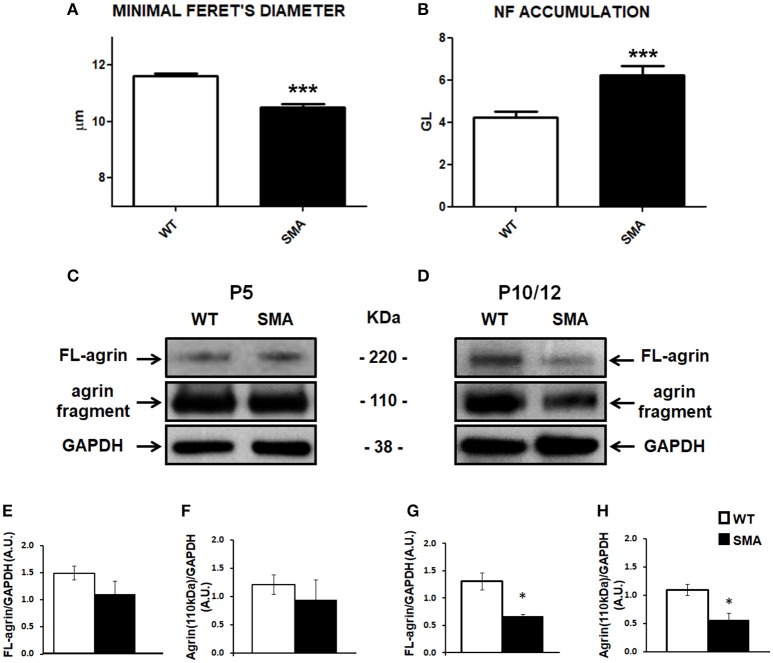
Figure 1.
Analysis of muscular/NMJ morphology and agrin expression levels in the quadriceps of SMA mice. (A) Minimal Feret's diameter measured in P10 WT and SMA quadriceps. (B) Accumulation of neurofilament quantified by Imaris software and expressed as gray level. (C,D) Representative Western blots displaying full length (FL) agrin protein and the proteolytic fragment of 110 kDa in quadriceps of WT and SMA mice at P5 (C) and at P10 (D). Graphs below each image report the quantification of FL-agrin/GAPDH protein levels at P5 (E) and P10 (G), and the 110 kDa agrin fragment at P5 (F) and P10 (H). Unpaired T-test, *P < 0.05, ***P < 0.001.

