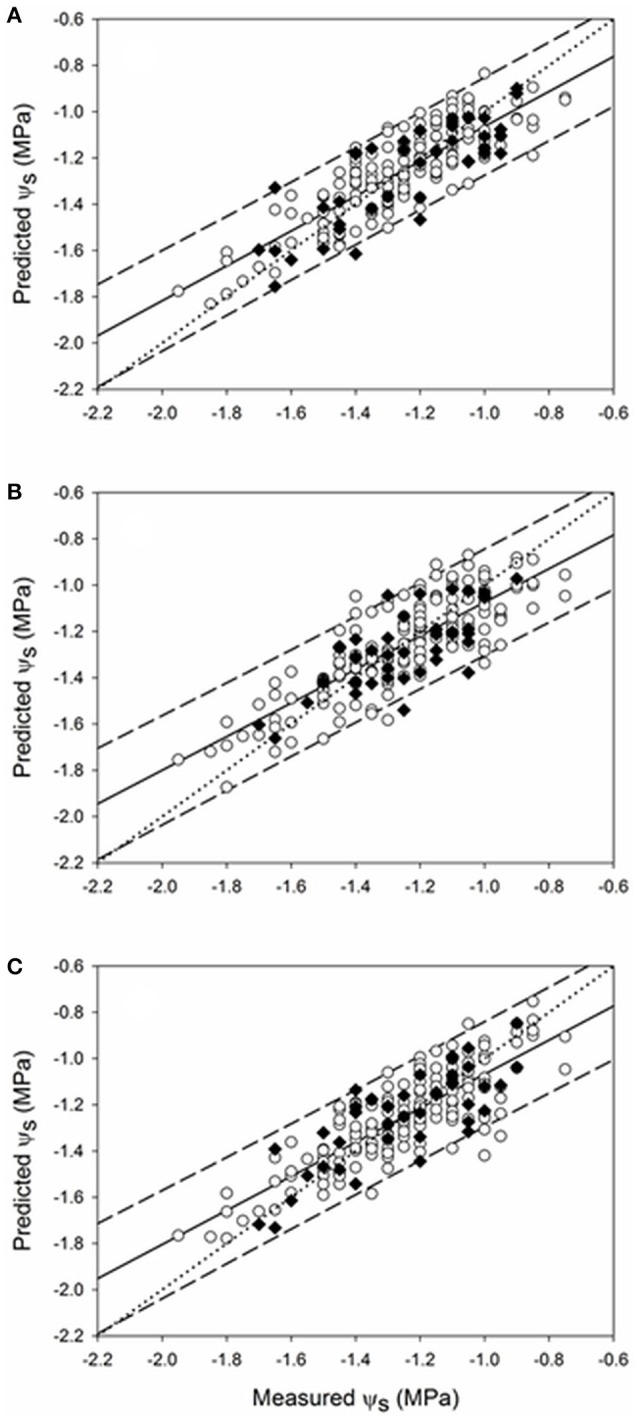
Figure 6.

Regression plots of ψs estimation using the best PLS models developed from data of season 2016 at the sub replication unit scale for (A) east ( = 0.68; Prediction RMSE = 0.132 MPa), (B) west ( = 0.54; Prediction RMSE = 0.131 MPa), and (C) east & west ( = 0.62; Prediction RMSE = 0.133 MPa) sides of the canopy. (○) 10-fold cross validation; (♦) prediction. Solid line represents the regression line and dotted line refers to the 1:1 line. Prediction confidence bands are shown at a 95% level (dashed lines).
