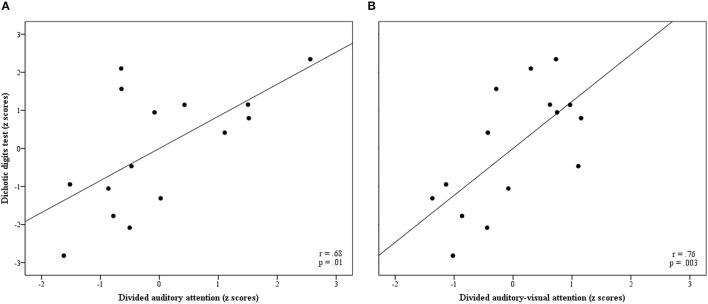
Figure 1.
Partial regression plots (A) between Div-AA and DDT z scores and (B) between Div-AVA and DDT z scores. Pearson's partial correlation coefficients and significance values are also included in each graph. DDT, Dichotic Digits Test; Div-AA, Divided Auditory Attention; Div-AVA, Divided Auditory-Visual Attention.

