. 2018 Jan 30;9:13. doi: 10.3389/fpsyg.2018.00013
Copyright © 2018 Anguera, Portell, Chacón-Moscoso and Sanduvete-Chaves.
This is an open-access article distributed under the terms of the Creative Commons Attribution License (CC BY). The use, distribution or reproduction in other forums is permitted, provided the original author(s) and the copyright owner are credited and that the original publication in this journal is cited, in accordance with accepted academic practice. No use, distribution or reproduction is permitted which does not comply with these terms.
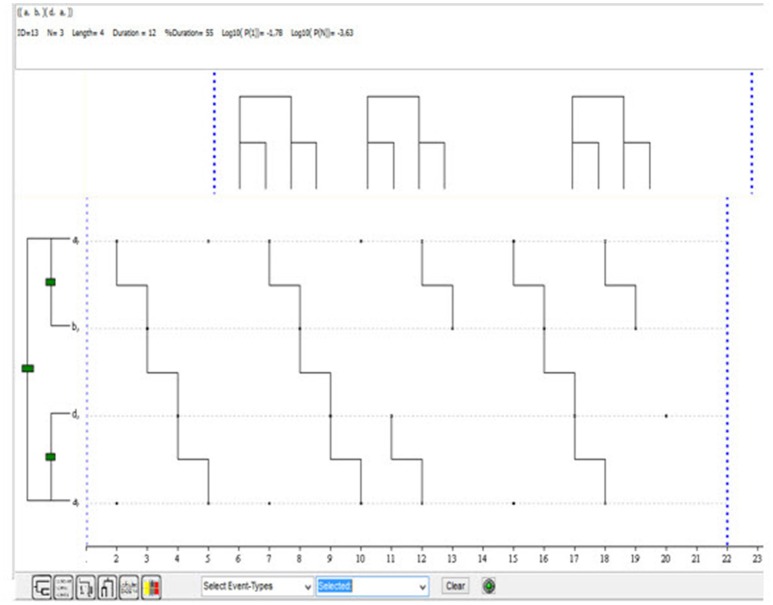
Figure 5.
First of the 13 T-patterns detected in the data from Table 3a (p < 0.05).

