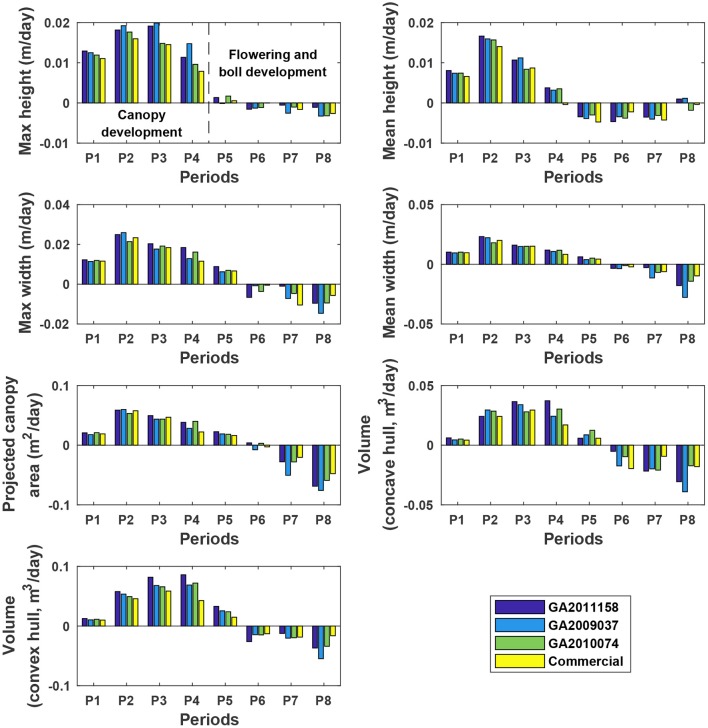
Figure 10.
Extracted growth rates (dynamic traits) of individual plots in ENGR field during the growing season. P1 was the period from the day of planting to DAP 45, and P2–P8 were the periods between two consecutive data collection dates. Extracted traits covered two growth stages: (1) canopy development from P1 to P4 (DAP 67 to DAP 74) and (2) flowering and boll development from P4 to P8 (DAP 102 to DAP 109).

