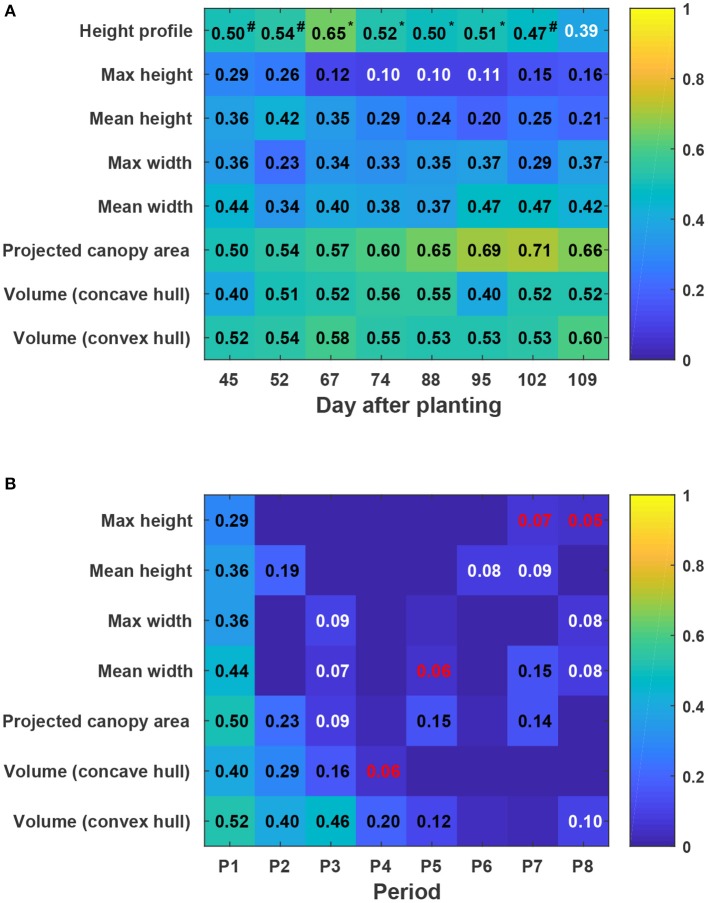
Figure 11.
Coefficients of determination (R2) of linear regressions between extracted traits and cotton fiber yield: (A) Static traits and fiber yield and (B) dynamic traits and fiber yield. Black, white, and red colors indicated statistical significance of “<0.001,” “<0.01,” and “<0.05,” respectively. Insignificant R2 values were not shown in blocks. P1 was the period from the day of planting to DAP 45, and P2–P8 were the periods between two consecutive data collection dates. Superscripts of R2 values for height profile denoted the F-test results between regression models: a number sign (#) indicated a significant model improvement by using height profile rather than maximum height, and an asterisk (*) indicated a significant model improvement by using height profile rather than both maximum and mean heights (see Table S15 for detailed F-test results). In addition, Pearson's correlation coefficients were calculated for all univariate traits (see Figure S5).

