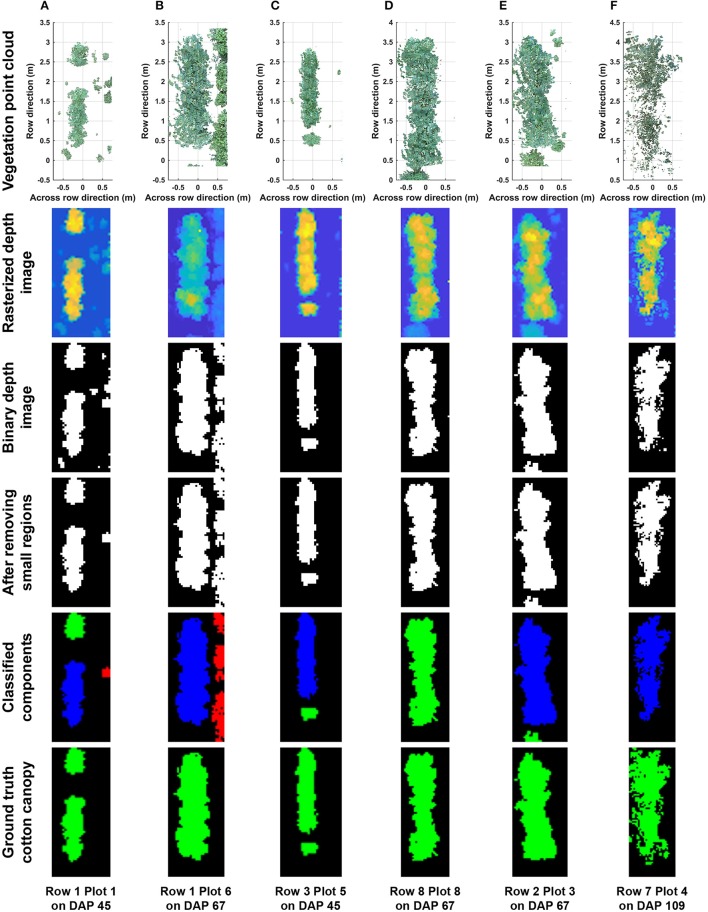
Figure 4.
Representative results of cotton canopy segmentation: successful segmentation under (A) poorly germinated plot with weeds, (B) well germinated plot with weeds, (C) plot with a segregated plant, and (D) well germinated plot with connected weeds; (E) failure of weed removal; and (F) over-removal of cotton plant canopy. In classified connected component images, blue, green, and red colors indicated main canopy, cotton canopy, and weeds, respectively. Ground truth images were manually generated for including cotton canopy.

