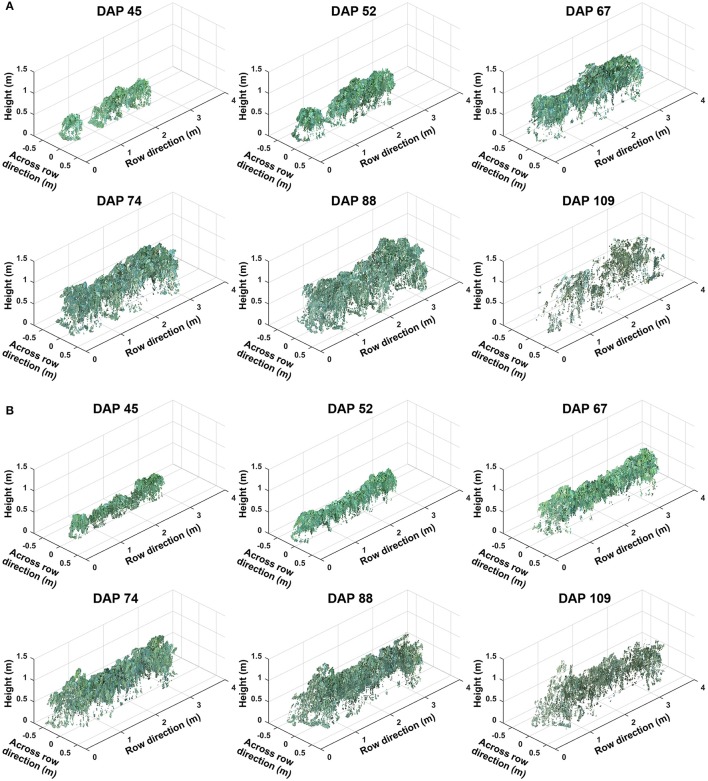
Figure 5.
Representative point clouds of the same plot during the growing season: (A) A plot with poor germination rate (less than 50%) and (B) a plot with good germination rate (greater than 75%). Collected data covered two growth stages: (1) canopy development from days after planting (DAP) 45 to 74 and (2) flowering and boll development from DAP 74 to DAP 109.

