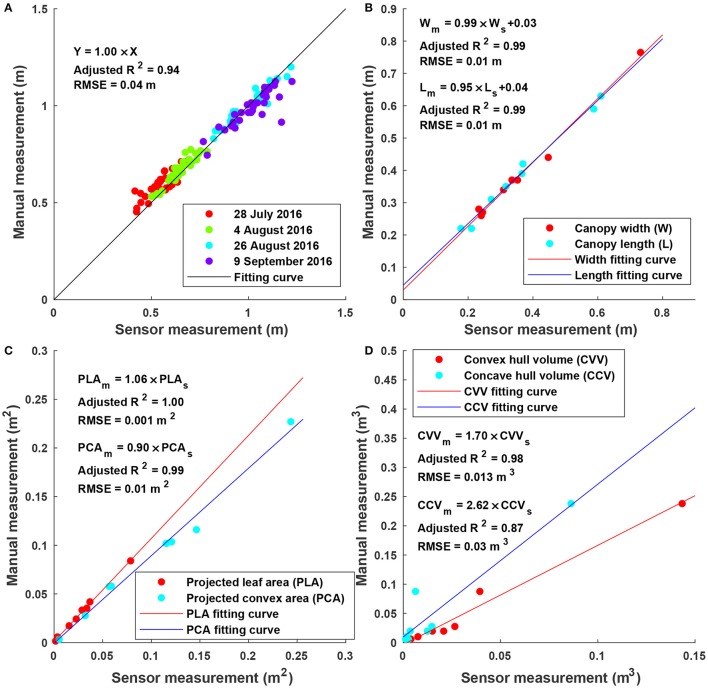
Figure 6.
Linear regression results between sensor and manual measurements for height, width, length, projected leaf/convex area, and volume: (A) Maximum canopy height (N = 128) for individual plots on four dates; (B) canopy width and length (N = 8 for each) for potted plants; (C) projected leaf and convex area (N = 8 for each) for the artificial plant with different layouts; and (D) volume (N = 8) for potted plants.

