
Figure 1.
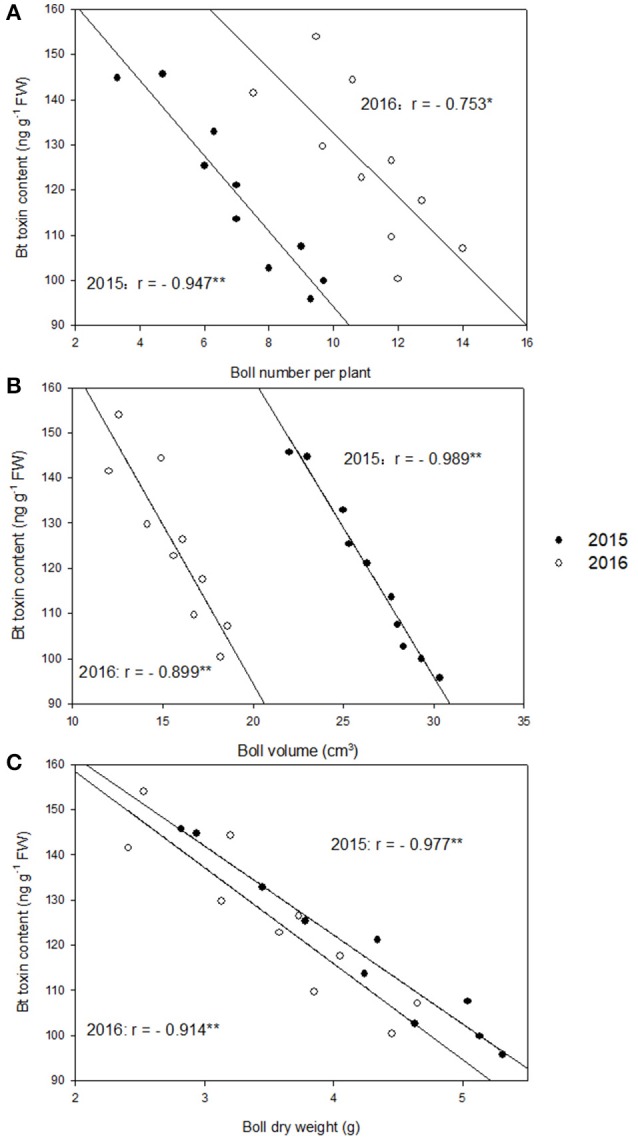
Correlations between boll shell Bt toxin content and boll number per plant (A), boll shell Bt toxin content and boll volume (B), and boll shell Bt toxin content and boll dry weight (C) at 20 DAF (days after flowering) in 2015 and 2016. * and ** represent the significant level of 0.05 and 0.01, respectively.