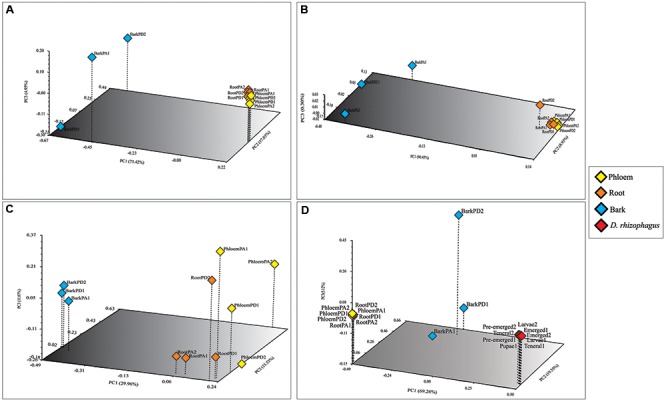
FIGURE 4.

Principal coordinate analyses (PCoA) of the endophytic bacterial communities associated with root, phloem, and bark of Durango and Arizona pines samples. (A) Bray–Curtis dissimilarity, (B) weighted and, (C) unweighted UniFrac distances; and PCoA of the endophytic bacterial communities associated with root, phloem, and bark of Durango and Arizona pines and D. rhizophagus samples (D) Bray–Curtis dissimilarity. The percentages of variation explained by each axis are shown in parentheses. Orange diamonds represent the root samples. Yellow diamonds represent the phloem samples. Blue diamonds represent the bark samples. Red diamonds represent the D. rhizophagus samples (RootPD1 = Root P. durangensis1, RootPD2 = Root P. durangensis2, PhloemPD1 = Phloem P. durangensis1, PhloemPD2 = Phloem P. durangensis2, BarkPD1 = Bark P. durangensis1, BarkPD2 = Bark P. durangensis2; RootPA1 = Root P. arizonica1, RootPA2 = Root P. arizonica2, PhloemPA1 = Phloem P. arizonica1, PhloemPA2 = Phloem P. arizonica2, BarkPA1 = Bark P. arizonica1).
