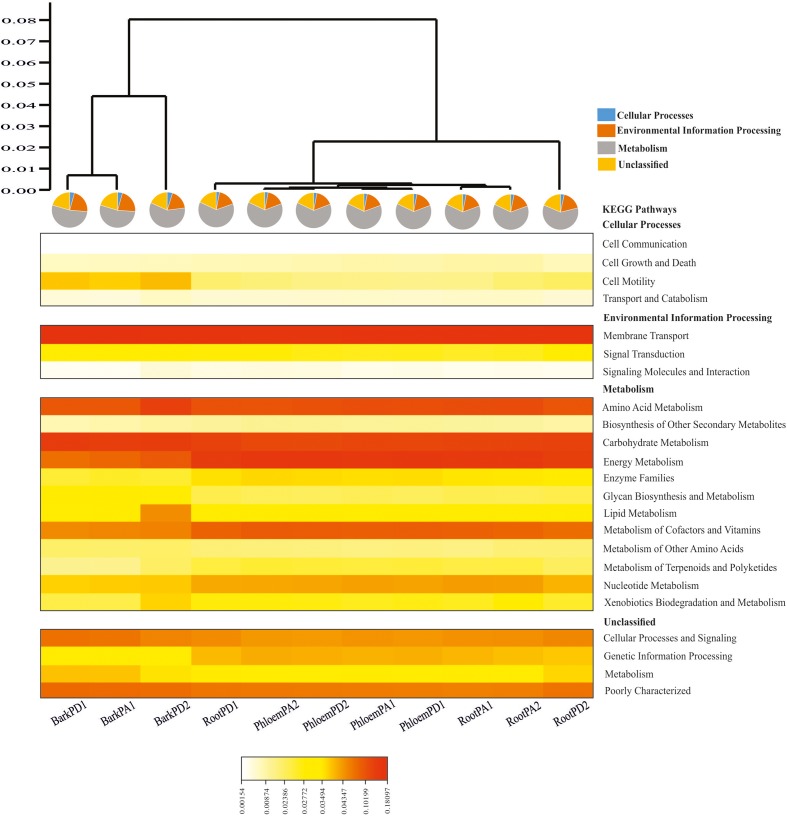
FIGURE 5.
Heatmap depicting the PICRUSt-inferred gene relative abundance in the predicted endophytic bacterial communities of root, phloem, and bark of Arizona and Durango pines samples (cophenetic correlation = 0.98). Warm colors represent high abundances and clear colors represent low abundances (RootPD1 = Root P. durangensis1, RootPD2 = Root P. durangensis2, PhloemPD1 = Phloem P. durangensis1, PhloemPD2 = Phloem P. durangensis2, BarkPD1 = Bark P. durangensis1, BarkPD2 = Bark P. durangensis2; RootPA1 = Root P. arizonica1, RootPA2 = Root P. arizonica2, PhloemPA1 = Phloem P. arizonica1, PhloemPA2 = Phloem P. arizonica2, BarkPA1 = Bark P. arizonica1).

