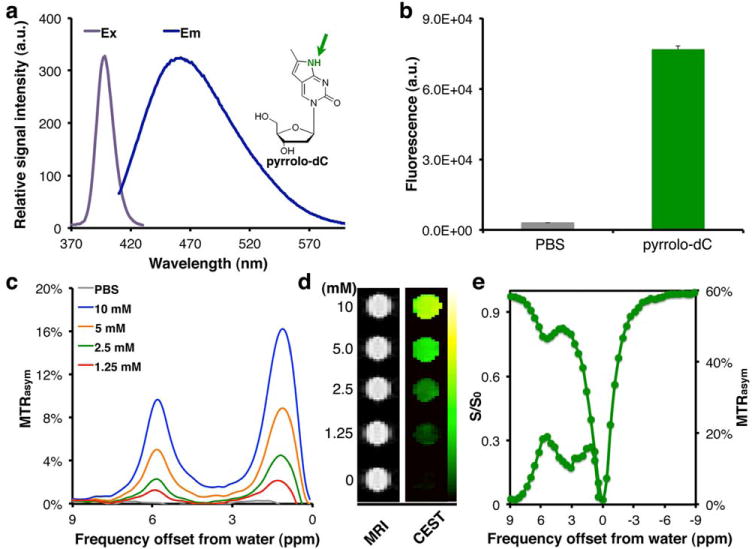
FIG. 2.

Imaging features of pyrrolo-dC. (a) Ex (gray) and Em (blue) spectra of pyrrolo-dC (inset) in solution. Arrow points to MRI CEST-detectable imino proton. (b) Fluorescent signal from 20 mM pyrrolo-dC. (c) MTRasym plots of pyrrolo-dC in solution. Corresponding (d) MR images (left) and MTRasym maps at 5.8 ppm (right), (e) CEST-spectra and MTRasym plots obtained using a 3T clinical scanner.CEST, chemical exchange saturation transfer; Em, emission; Ex, excitation; PBS, phosphate-buffered saline; pyrrolo-dC, pyrrolo-2′-deoxycytidine; T, tesla.
