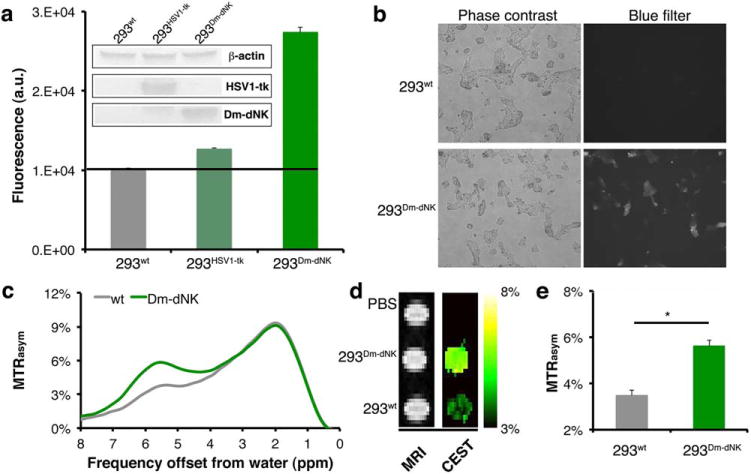
FIG. 3.

In vitro imaging of Dm-dNK expression. (a) Emitted fluorescence from cell lysate after 3 hours incubation with 4 mM pyrrolo-dC. Shown are HEK 293T cells (293wt) and cells that were transiently transfected with either HSV1-tk (293HSV1-tk) or Dm-dNK (293Dm-dNK) (n = 4). Inset shows Western blot analysis of cell extracts using an anti-V5 tag antibody for staining of HSV1-tk and Dm-dNK expression, with anti-β-actin as a control. (b) Microscopic images of 293wt and 293Dm-dNK incubated for 3 hours with pyrrolo-dC. (c-e) CEST MRI of cell lysates (293wt and 293Dm-dNK) incubated for 3 hours with 4 mM of pyrrolo-dC. (c) Representative MTRasym plot (293wt, gray; and 293Dm-dNK, green). (d) MR images of phantoms without a saturation pulse (right) and MTRasym maps (radiofrequency saturation at Δω = 5.8 ppm). (e) Averaged MTRasym values (with standard error of mean) from maps in d (n = 3).CEST, chemical exchange saturation transfer; Dm-dNK, drosophila melanogaster 2′-deoxynucleoside kinase; HSV1-tk, herpes simplex virus thymidine kinase type 1; PBS, phosphate-buffered saline; pyrrolo-dC, pyrrolo-2′-deoxycytidine; wt, wild type.
