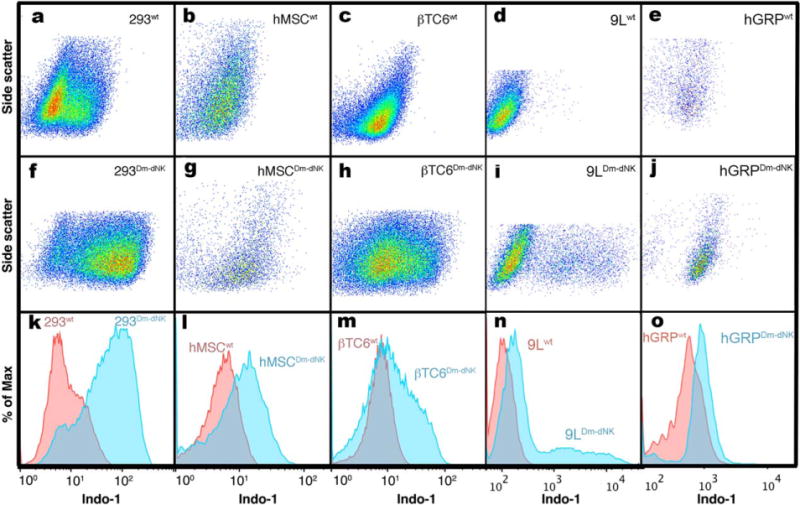
FIG. 4.

Flow cytometry analysis of wt- and Dm-dNK–transduced mammalian cell lines incubated with 4 mM pyrrolo-dC. Following incubation with 4 mM pyrrolo-dC, cells were analyzed via flow cytometry for pyrrolo-dC retention, which can be detected in the Indo-1 channel. HEK 293 (a, f, k), hMSC (b, g, l), βTC6 (c, h, m), 9L (d, i, n), and hGRP (e, j, o). Scatter plots (a-j) of side scatter versus Indo-1 (blue) channel of wt- (a-e) and Dm-dNK–expressing (f-j) cells. FACS histograms (k-o) display relative blue fluorescence of wt- (red histogram) and Dm-dNK–expressing cells (blue histogram) for each of the examined cell lines (a and f, b and g, c and h, d and i, e and j). Increased blue fluorescence corresponds to increased retention of pyrrolo-dC.9L, rat glioma; βTC6, mouse insulinoma cells; Dm-dNK, drosophila melanogaster 2′-deoxynucleoside kinase; FACS, fluorescence-activated cell sorting; HEK 293, human embryonic kidney 293; hGRP, human glial-restricted progenitors; hMSC, human mesenchymal stem cells; HSV1-tk, herpes simplex virus thymidine kinase type 1; pyrrolo-dC, pyrrolo-2′-deoxycytidine; wt, wild type.
