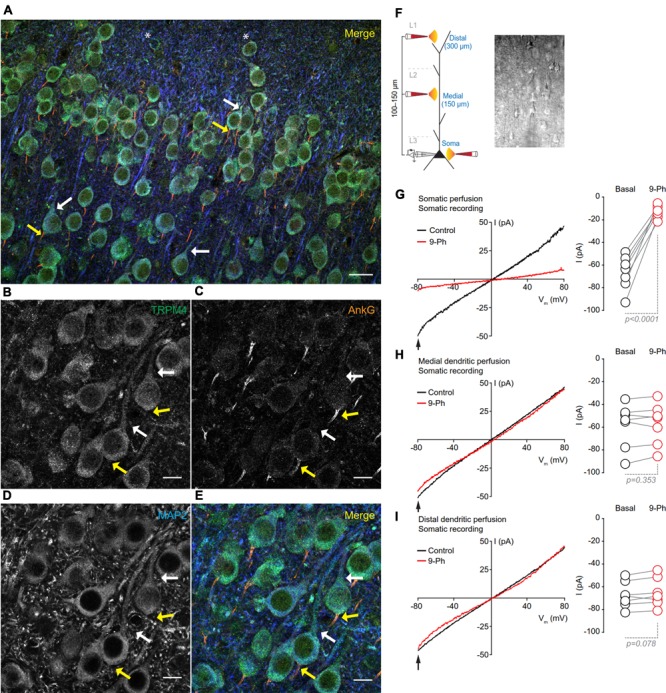
FIGURE 3.

TRPM4 expression is restricted to the somatodendritic region of the pyramidal neurons at mPFC layers 2/3. (A) Confocal images from triple immunofluorescence labeling for TRPM4 (green), MAP2 (blue), and AnkG (orange) in the mPFC in a coronal mouse brain section at P35. Magnification of layers 2/3 showing (B) TRPM4, (C) MAP2, (D) AnkG and (E) merge of the three signals, white arrows indicate TRPM4 and MAP2 co-expression in proximal dendrites, yellow arrows indicate AnkG expression in the AIS, which does not contain detectable TRPM4 immunolabeling. Scale bar: A = 20 μm; B–E = 10 μm. (F) Schematic figure showing the areas of drug perfusion and a DIC picture of the recorded area. Representative I/V curves (–80 to 80 mV, 0.16 mV/ms) recorded in the soma using local somatic (G), medial, (H), and distal dendrite (I) drug perfusion; black traces represent the basal current, red traces represent the effect of 10 μM 9-Ph. Right panels showed the quantification of the currents at –80 mV (arrow) (n = 7). All experiments were performed in the presence of glutamatergic (CNQX, AP5) and GABAergic blockers (Picrotoxin).
