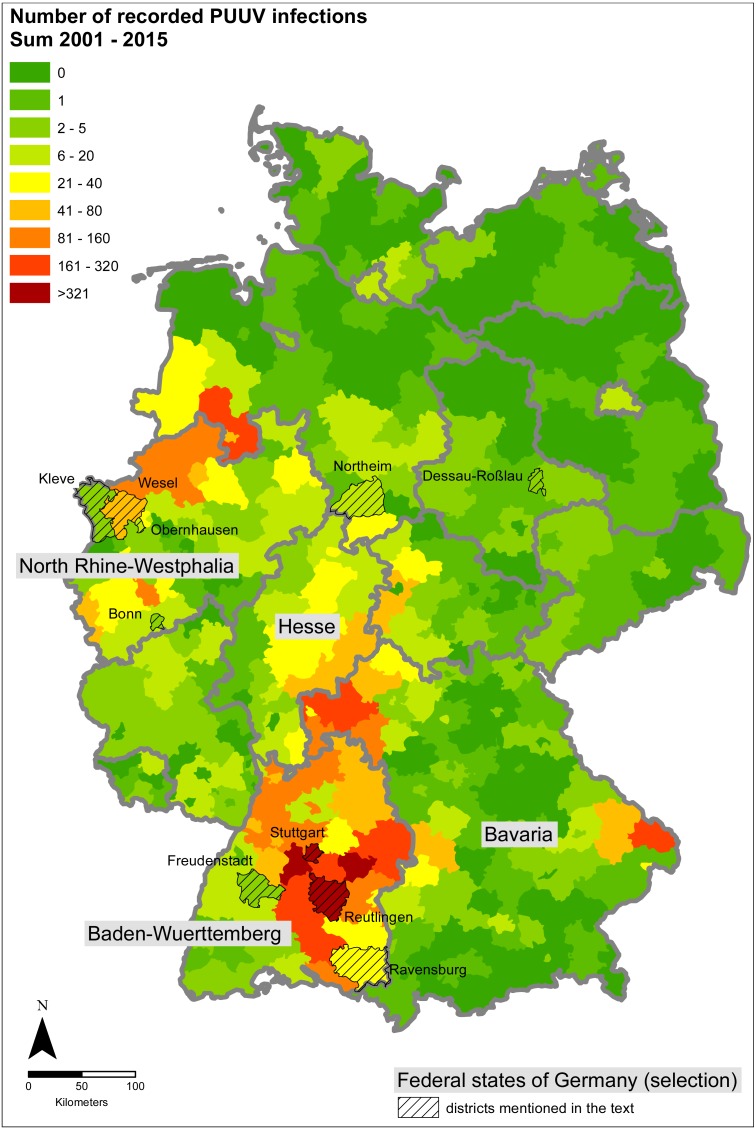
Figure 2. Sum of the recorded PUUV infections between 2001 and 2015.
The eight districts that show a significant positive trend between 2001 and 2015 are labelled and hatched. The figure based on data provided by the Robert Koch Institute and the GeoBasis-DE/BKI, and was built using ESRI ArcGIS 10.3 (ESRI, Redlands, CA, USA).

