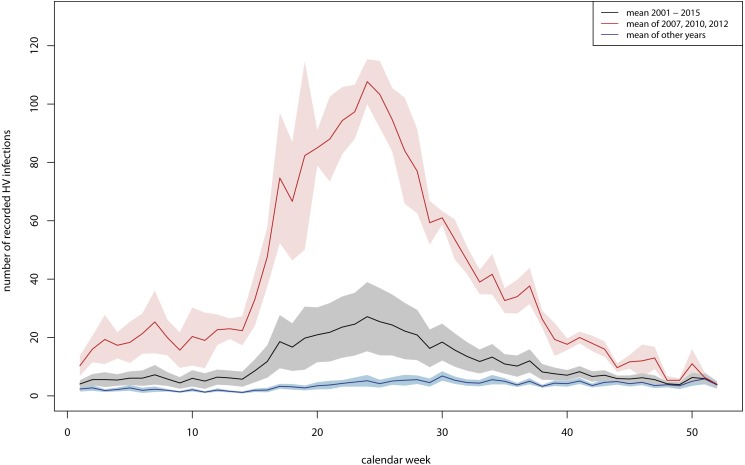
Figure 5. Seasonal pattern of recorded human PUUV infections in Germany.
In black: mean average over the years 2001 to 2015 and (in grey: mean average ± standard error), in red: mean average over the three years with a high number of recorded PUUV infections (2007, 2010 and 2012) (in light red: mean average ± standard error), in blue: mean average over the 11 years with a low number of recorded PUUV infections (2001 to 2006, 2008, 2009, 2011, 2013 and 2014) (in light blue: mean average ± standard error). The figure based on data provided by the Robert Koch Institute, and was built using R 3.4.2 (R Core Team, 2016).

