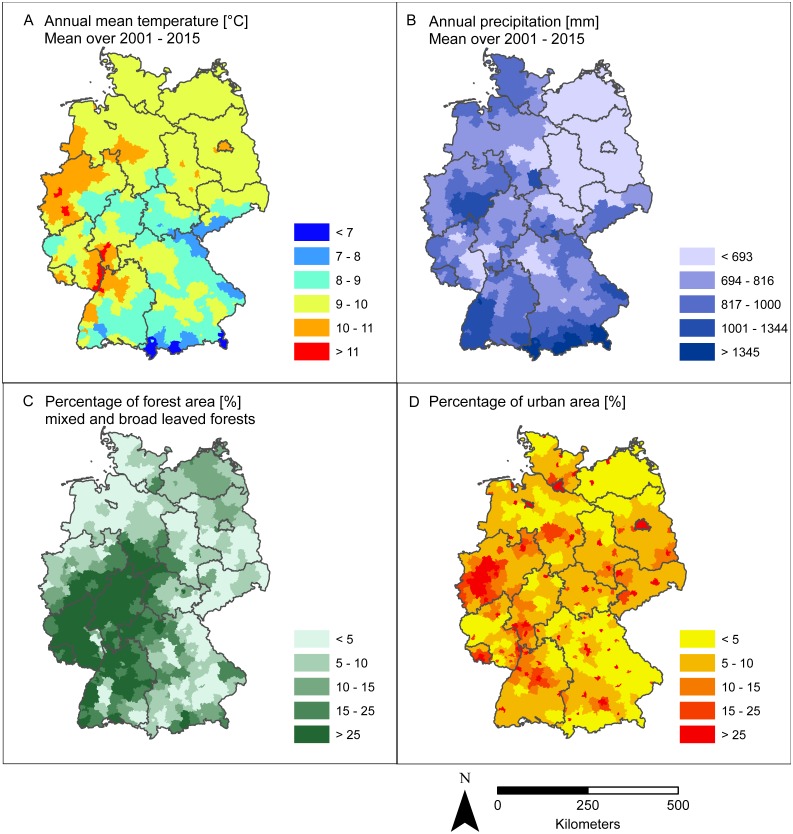
Figure 6. Spatial pattern of four environmental factors that are supposed to affect the spatial pattern of recorded PUUV infections (cf. Fig. 2).
(A) Annual mean temperature (°C); (B) Annual precipitation (mm); (C) Percentage of forest area (%); (D) Percentage of urban area (%). The figure based on data provided by the Deutscher Wetterdienst, the European Environment Agency, and was built using Esri ArcGIS 10.3 (ESRI, Redlands, CA, USA).

