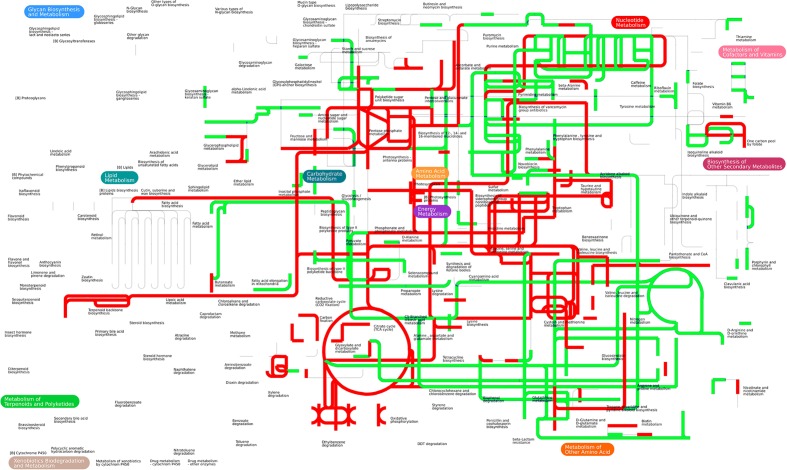
FIGURE 3.
Integrated proteomic and metabolomics analysis in iPath. Forty differentially expressed proteins and 47 differentially expressed metabolites were simultaneously analyzed in iPath software. The color indicates expression change (red indicates up-regulation, and green indicates down-regulation).

