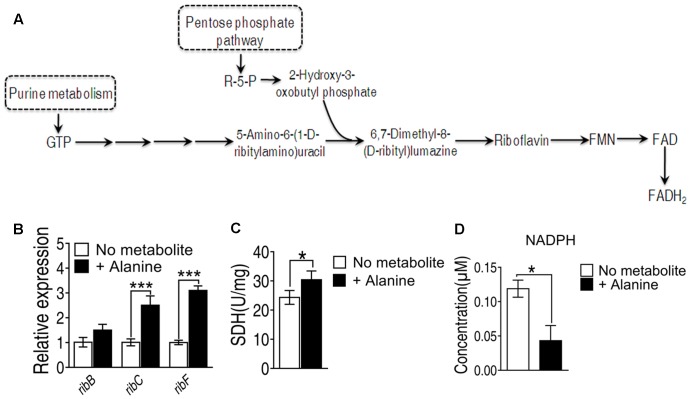
FIGURE 5.
(A) Metabolic pathway of riboflavin metabolism and genes involved in each reaction. (B) Transcriptional level of genes of riboflavin metabolism; (C) Succinate dehydrogenase activity was measured in the presence of alanine. (D) Intracellular concentration of NADPH induced by alanine. ∗p < 0.05, ∗∗p < 0.01, and ∗∗∗p < 0.001 as determined by Student’s t-test.

