Abstract
A resistive pulse sensing device is able to extract quantities such as concentration and size distribution of particles, e.g. cells or microspheres, as they flow through the device’s sensor region, i.e. channel, in an electrolyte solution. The dynamic range of detectable particle sizes is limited by the channel dimensions. In addition, signal interference from multiple particles transiting the channel simultaneously, i.e. coincidence event, further hinder the dynamic range. Coincidence data is often considered unusable and is discarded, reducing the throughput and introducing possible biases and errors into the distributions. Here, we propose a two-step solution. We code the channel such that the system response results in a Manchester encoded Barker-Code sequence, allowing us to take advantage of the code’s pulse compression properties. We pose the parameter estimation problem as a sparse inverse problem, which enables estimation of particle sizes and velocities while resolving coincidences, and solve it with a successive interference cancellation algorithm. We introduce modifications to the algorithm to account for device fabrication variations and natural stochastic variations in flow. We demonstrate the ability to resolve coincidences and possible increases in the device’s dynamic range by screening particles of different size through a Barker encoded device.
Index Terms: Coincidence Correction, Barker Codes, Inverse Problems, Successive Interference Cancellation, Coulter counter
1. INTRODUCTION
The resistive-pulse technique [1][2] (i.e. the Coulter-counter technique [3]) is widely employed in many fields, including for example, cell biology [4], clinical medicine [5], pathogen detection [6], and the food industry [7], to measure the concentration and size distribution of particles, e.g. cells or microspheres, in solution. The traditional Coulter counter [8] consists of a solution of particles flowing through an channel while a voltage potential is applied across and the current through the channel is monitored. The current response, or impedance response via Ohm’s law, is perturbed by particles as they transit the channel, temporarily increasing the impedance of the channel.
Coulter counters are limited by dynamic range [9] of the size particle they can detect. The resulting impedance impulse amplitude of a particle is proportional to the particle’s volume divided by the channel’s volume. Hence, particles with smaller radii will exhibit significantly smaller signal amplitudes that quickly drop below the noise floor, thus avoiding detection. This problem is exacerbated in coincidence situations where more than one particle passes the channel at the same time. In this case, the impedance signals will be superimposed, thus small particles’ signals will be dominated by larger particles’ signals. In general, coincidences could lead to ambiguities in the size and velocity of particles, therefore such data is often discarded, introducing errors into the measurement of particle concentration and particle size distribution [10][11]. These coincidence events could be avoided by decreasing the concentration of particles in solution, at the cost of reducing the throughput of the system. Different techniques aim to correct these coincidence errors with more complex electrode sensor array systems [12][13] or complex statistical analysis [10].
In previous work by Balakrishnan et al. [9], it was demonstrated that the system response can be modulated by fabricating channels with wider (nodes) and narrower (pores) regions in a controlled manner (Fig. 1a). Hence, these devices are referred to as node-pore sensing (NPS) channels. Since the node’s cross sectional area is much larger than the particle, as particles transit from the narrow pore section to the wide node section, the impedance response will nearly return to baseline (Fig. 1b), thus enabling pulse amplitude signal modulation. In Rivest et al. [14], we demonstrated that it is possible to fabricate long coded NPS channels to output modified Barker-code [15] sequences, such that the optimal pulse compression properties of Barker codes (Fig. 1c) will help resolve coincidence events in a similar way as they are used to separate targets in high-resolution radar. Due to the one-sided nature of our impedance signal, we adapted the Barker code by encoding its bit-values in signal transitions, i.e. 0 as 01, 1 as 10, Manchester encoding [16]. Impedance transitions from high-to-low are coded by transition from narrow pores to wider nodes and vice versa. The combined Manchester-Barker (MB) code is shown in Fig. 1d.
Fig. 1.
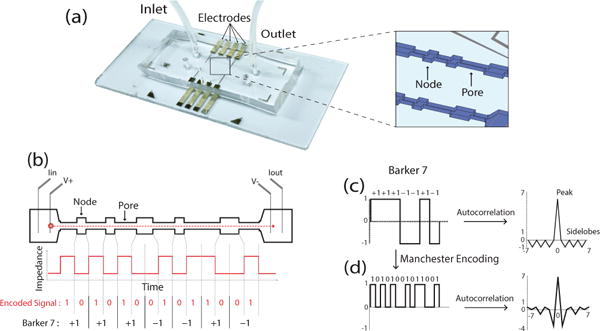
Manchester Barker Code Device and Matched Filter Response: (a) Polydimethylsiloxane channel encoded with MB code bonded to glass substrate with four-probe sensor, (b) NPS channel and resultant impedance signal of single transiting particle, (c) traditional Barker seven code and matched filter response, (d) manchester encoded Barker seven code and matched filter response.
It is worth noting that a recently published related work using coded microfluidic devices has been conducted by Liu et al. [17] to resolve coincidence events when sensing the multiplexed signals from an array of microfluidic channels. Their signals were differentially encoded with a set of complementary Gold codes, implemented via a complex co-planar electrode array. In contrast to their work, which enables separation of particles crossing different channel at the same time, our work enables optimal separation of particles crossing a single channel.
Here, we propose a special deconvolution as an inverse problem to resolve coincidences and a modified successive interference cancellation [18] (SIC) algorithm solve the inverse problem. Previous work [14][17] has explored SIC methods for resolving coincidences, but did not consider significant issues and undesirable artifacts, such as baseline drift, manufacturing imperfections, dynamic range of valid detections, and low-resolution parameter estimation, that result in numerous miss-detection or false alarms and biased particle size estimates. We discuss and incorporate a forward model calibration step, an adaptive threshold detection scheme, and a robust regression fit to mitigate these sources of error.
2. MATERIAL AND METHODS
2.1. System Modeling
The impedance measurements (yt) for particles passing through the channel can be well approximated as a particle transit-time dependent convolution of the system response (hτ) with a series of scaled impulse functions (xt). Each impulse represents the crossing time and signal amplitude of a single particle. In addition, a time varying affine term is added to account for slow moving baseline drift (bt). We finally include an additive gaussian noise term (nt), which we assume here to be white for simplicity.
| (1) |
This problem can be formulated in matrix form as
| (2) |
where the columns of A consist of unit-amplitude shifted and scaled dictionary of channel responses, and x a sparse vector in which each non-zero element represents the signal amplitudes of an individual particle, and its indices representing the particle’s arrival-time and transit-time. This concept is illustrated in Fig. 2b.
Fig. 2.
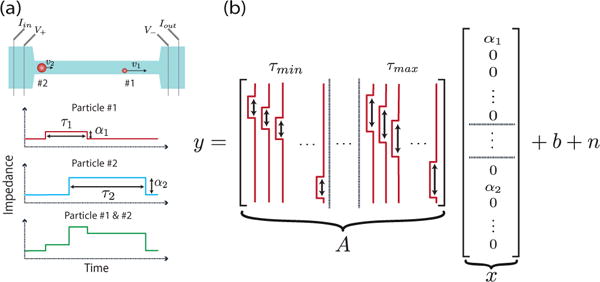
Coincidence Event and Forward Model Construction: (a) a long channel and the resultant impedance signal of a coincidence event, (b) decomposition of a signal resulting from part a into equation 2: a forward model, A, a sparse vector, x, a baseline, b, and a noise term, n. The forward model is a dictionary of channel response signals parameterized by arrival-time and transit-time. x is a sparse vector representing individual particle’s amplitudes at indices representing the arrival-time and transit-time of these particles.
2.2. Inverse Problem Formulation
The problem of measuring particles’ signal amplitude, arrival and transit times can be viewed as a deconvolution. We pose the deconvolution as the following sparsity constrained inverse problem
| (3) |
in which the number of particles transiting the channel, k, in a fixed period of time is constrained by the concentration of particles in the solution, represented by k. We aim to solve for appropriate sparse entries in x corresponding to arrival and transit times. We also simultaneously solve for the baseline, b, which is constrained to be smooth using ℓ2 regularization of its second order difference function, represented by the D operator.
2.3. Implementation using Successive Interference Cancellation
To simplify the process, and reduce complexity, we break the input signal into overlapping blocks. Each block is processed separately, and the results are consolidated at the end. For each block, we attempt to solve the sparse deconvolution using a greedy SIC algorithm, similar to orthogonal matching pursuit [19]. Figure 3 illustrates our method. It is outlined by iterating a sequence of correlations with a matched filter-bank (i.e., the dictionary), detection, fit, and cancellation steps. Over the iterations we construct a list of the strongest detections, referred to as the list of true detections. Each iteration we jointly fit all the true detection models to the data to estimate the particle sizes as well as the smooth baseline. We grow the list by adding the strongest unique detection each iteration. By cancelling/peeling the strongest signal in each iteration, we allow for impedance response of smaller particles to be detected in successive rounds. Figure 4 illustrates a single iteration of our method.
Fig. 3.
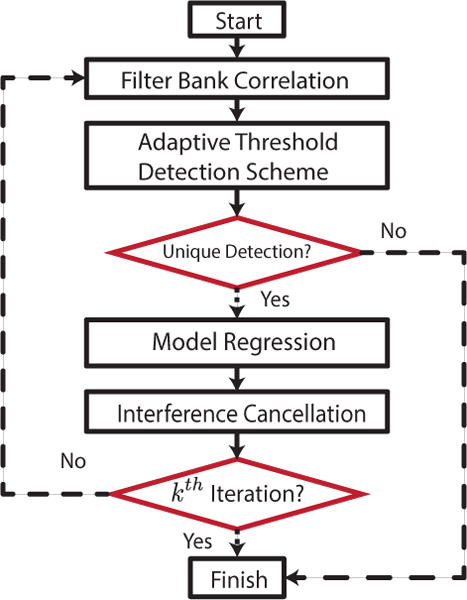
Successive Interference Cancellation Flow Chart: An overview of our SIC algorithm blocks, transitions (solid arrows), and decisions (dashed arrows)
Fig. 4.
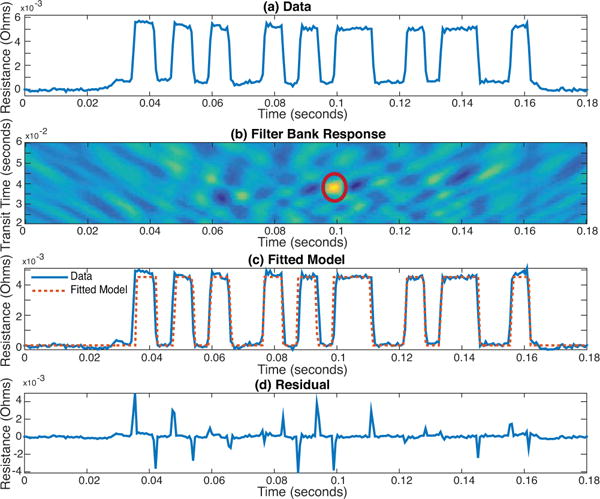
Single SIC Iteration: (a) Manchester Barker 11 coded system response of single particle, (b) matched filter-bank response of raw data with single detection (red circle), (c) detected model fitted (red dashed) to raw data (blue solid), (d) residual between the raw data and the fitted model exhibits spike signals at points of signal transitions due to modeling errors.
2.4. Basic Methodology
In this section we first describe a basic approach for implementing the SIC algorithm. Later we address necessary improvements for dealing with practical device and particle issues. Figure 4 demonstrates a single iteration of the algorithm on a block of data. First, we apply the conjugate, i.e. A∗, matrix to the data. This operation is equivalent to filtering with a matched filter bank of scaled MB codes. The filter bank is comprised of normalized filters each with a unique transit-time parameter such that the continuous space is linearly discretized over a range of plausible particle transit times. Figure 4a shows a typical MB-11 response and Fig. 4b shows the filter-bank response, in which the dominating peak position indicates a detected particle.
An adaptive threshold detection scheme [20] is performed on the matched filter-bank response to localize a particle’s arrival and transit time parameters. The large dynamic range of particle sizes could yield different levels of ‘true-peaks’ corresponding to actual particles, and ‘false-peaks’ corresponding to side-lobes. Therefore an adaptive scheme is necessary to mange false alarms and misdetections. Each correlation value is evaluated against a threshold derived from an estimate of the surrounding signal energy. The adaptive scheme will select a threshold that is appropriate to detect a wide dynamic range of particle sizes, and is based on a constant false alarm-rate criteria [21].
The adaptive thresholding chooses a list of possible candidates, from which a single unique detection, corresponding to the greatest correlation value is selected for each iteration. The transit-time estimate for the detection is chosen to be that of the best correlating matched filter. To determine the amplitude, a least square regression is performed to fit the signal of the detected peaks (from current and previous iterations) and baseline to the data. Figure 4c shows an example of a resulting fit. More formally, we define Ãi, to be a subset of columns of A corresponding to signal responses of already detected particles by the ith iteration, and to be the unknown signal amplitudes of the subset of detected peaks by the ith iteration. In that case, the entire least-squares fit at the ith iteration is formulated as,
| (4) |
where λ controls the smoothness of the baseline. Finally, the time signals of the detected particles are computed and subtracted from the acquired signal by computing . This residual is used as an input to the next iteration for the purpose of possibly detecting other particles. The residual is illustrated in Fig. 4d.
This process is repeated until either of the stopping conditions, i.e., no more detections in the block or the process reaches the kth iteration of SIC. The second stopping criteria enforces the sparsity constraint from equation 3. In post-processing particle sizes are computed as a function of channel dimensions and pulse height via the method outlined in DeBlois et al. [22].
2.5. Sources of Forward Model Error
Figures 4d and 5 show that the calculated residual has spikes, which correspond to model mismatches at the signal transitions. Model mismatches can be attributed to (a) the manufacturing of the devices, (b) stochastic variations in the flow of particles through the device, and (c) the discretization of the continuous transit-time parameter space. These residual outliers will cause biases in particles’ arrival and transit times as well as the particles’ size estimates.
Fig. 5.

Microsphere Results: A scatter plot of results from colloid experiments. Plot of estimated transit time (seconds) versus estimated diameter (μm) of colloid. Three ovals overlaid to highlight the three detected colloid sizes.
Standard soft-lithography manufacturing imperfections result in deviations from the specified channel dimensions, leading to deviations from the expected forward model. From a communications point-of-view, these imperfections cause deviations from a uniform number of samples per symbol. Visually, the pulses of the data and the ideal model are not aligned and the residual signal after cancellation has sparse spiky errors at the edges. In addition, stochastic variations in the flow of the particles through the device can also cause similar deviations. Both of these bias the least-square estimate of the pulse heights. The transformation of the forward model to matrix form requires the discretization of the continuous transit-time parameter space. A high resolution transit-time parameter space would be required to properly approximate the signal. Fine discretization requires a larger filter bank, increasing computation. Coarse discretization causes the data to mismatch with the model and results in similar outlier residuals.
2.6. Model Error Reduction and Robust Regression
To mitigate the device imperfections we use a calibration step in which the signal transition times are calibrated from the data, and are used to correct the ideal MB-code model. Specifically, the calibration is achieved by performing a first pass using the ideal MB-code model. Then, tabulating a list of impedance responses from high SNR detection. For each detection we calculate a normalized samples per symbol rate, and then select the median number of samples for each symbol as the true geometry. A new filter bank is regenerated from the calibration.
To reduce computation we use a coarse forward model. To regain accuracy in arrival and transit time resolution we interpolate the filter-bank response around the detected peak by linearly weighting local transit-time parameters by their respective correlation energies. The recalculated parameters are then used to generate Ãi, used in the aforementioned least-squares fit step.
Even with these steps, we still observe outlier residuals, which are likely due to the stochastic variations in the flow of particles through the device. To reduce the bias of our particles’ size estimate we interchange the least-square regression with a robust regression [23]. We solve the robust regression as an iterative reweighted least square (RLS) [24] problem, where the W term is used to reweight the data consistency term to make equation 4 equivalent to the ℓ1-norm minimization (Eqn. 5), which is well known to be robust to outliers. The weights are updated each jth sub-iteration according to equation 6. More specifically we solve
| (5) |
| (6) |
2.7. Experimental Setup
We screened a 1 : 1 : 1 ratio of 5μm, 10μm, and 15μm diameter polystyrene microspheres in phosphate-buffered saline at a concentration of 5×10⁵ particles/mL. We fabricated our microfluidic NPS channels using standard soft-lithographic techniques, as described in Balakrishnan et al. [9]. We applied 1-volt DC across the device and sampled the current through the device at 50 kHz.
3. RESULTS
As visualized in Fig. 5, the three clusters correspond to the three sizes of microspheres in solution. The 5μm diameter microsphere, previously undetectable, cluster contains fewer detections than the 10 μm and 15μm microsphere clusters. We attribute this to their inherently lower SNR (estimated SNR of 5 μm detection as low as 1.7707 dB) and reduced signal to interference ratio in coincidence settings due to forward model error. The 5μm and 10μm diameter microsphere clusters have greater variance in the transit time dimension than that of the 15μm diameter microsphere cluster. We attribute this to the flow rate spatially varying across a cross-section of the channel, referred to as parabolic flow. Particles relatively small compared to the cross-sectional area of the channel (5 μm diameter microspheres) can experience a wider variety of velocities near the channel edges, spreading their distribution. There are several detections between clusters. These could result from either particles that existed in the solution or from particles that clumped together.
Figure 6 shows a coincidence event where the signals of three particles overlap. It shows the SIC for three consecutive iterations, in which the interference of detected signals is sequentially peeled, enabling accurate recovery of the particles’ parameters. Figures 6b-6d illustrate the presence of the previously discussed outlier residual signals, but in these instance they do not affect the detection of particles in later iterations, nor bias the estimate of the amplitudes.
Fig. 6.
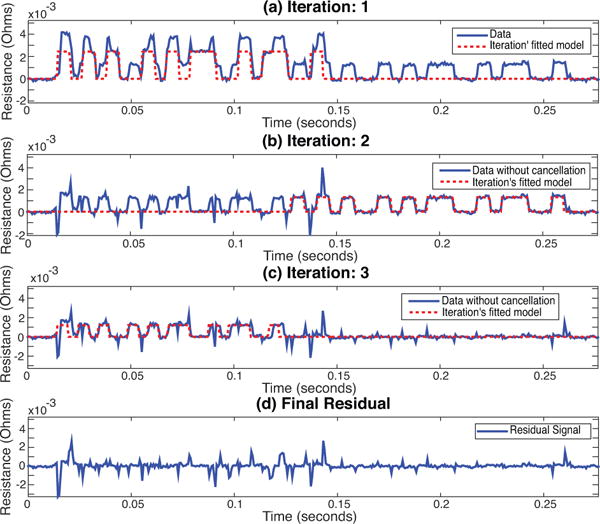
Coincidence Correction: (a) Fitted model (red dashed) of first iteration of our proposed method overlaid on raw data (blue solid), (b) fitted model (red dashed) of second iteration overlaid on residual (blue solid) from first iteration, (c) fitted model (red dashed) of third iteration overlaid on residual (blue solid) from second iteration, (d) final residual (blue) from third iteration.
4. DISCUSSION
The MB encoding of the channel allows smaller particles to be detected, increasing the dynamic range of the device. Devices outfitted with either/both longer channels or more complex codes could make it possible to further improve the dynamic range of the device. As the length and complexity of the device increases, we would expect to observe an increased number of coincident events and more channel imperfections, respectively, further motivating our advanced modifications to the general method.
Additional factors not accounted for in the forward model include violations to the assumption of constant flow rate. A violation of this assumption would result in a system response that also depends on the derivative flow rate. To account for this would increase the dimension of our forward model to intractable size and thus is not considered. On rare occasion, larger deviations from the forward model cause a degradation in our ability to detect particles’ presence, a mis-detection. Equally infrequently, we detect a particle that is not well represented in the forward model, resulting in unusual outlier residuals and possible false alarms in successive iterations.
5. CONCLUSIONS
We have demonstrated that by encoding a long microfluidic channel with a Barker-code arrangement of nodes and pores, we have the ability to increase the dynamic range of the device. Our special deconvolution algorithm is able to exploit this expected code structure in the system response to resolve coincidence events, a consequence of our long channel and high concentration of particles in solution. With the calibration step and robust regression we are able to mitigate the effects of channel imperfections and outlier residual signals. This has all been achieved while preserving the relatively simple configuration of the resistive pulse sensor.
Acknowledgments
Thanks to NIH R21EB01981-01A1 and NSF 1509921 grants and Michael Kellman’s National Science Foundation graduate research fellowship.
References
- 1.DeBlois RW, Bean CP. Counting and sizing of sub-micron particles by the resistive pulse technique. Review of Scientific Instruments. 1970;41(7):909–916. [Google Scholar]
- 2.Saleh OA, Sohn LL. Quantitative sensing of nanoscale colloids using a microchip coulter counter. Review of Scientific Instruments. 2001;72(12):4449–4451. [Google Scholar]
- 3.Coulter WH. Means for counting particles suspended in a fluid. 1953;10 [Google Scholar]
- 4.Chapman MR, Sohn LL. Label-free resistive-pulse cytometry. Methods Cell Biol. 2011;102:127–57. doi: 10.1016/B978-0-12-374912-3.00006-7. [DOI] [PubMed] [Google Scholar]
- 5.Nguyen J, Wei Y, Zheng Y, Wang C, Sun Y. On-chip sample preparation for complete blood count from raw blood. Lab Chip. 2015;15(6):1533–44. 3. doi: 10.1039/c4lc01251h. [DOI] [PubMed] [Google Scholar]
- 6.DeBlois RW, Wesley RK. Sizes and concentrations of several type c oncornaviruses and bacteriophage t2 by the resistive-pulse technique. J Virol. 1977;23(2):227–33. 8. doi: 10.1128/jvi.23.2.227-233.1977. [DOI] [PMC free article] [PubMed] [Google Scholar]
- 7.Mullin JW, Ang HM. Crystal size measurement: Comparison of the techniques of sieving and coulter counter. Powder Technology. 1974;10(3):153–156. [Google Scholar]
- 8.Graham MD. The coulter principle: foundation of an industry. Journal of the Association for Laboratory Automation. 2003;8(6):72–81. [Google Scholar]
- 9.Balakrishnan KR, Anwar G, Chapman MR, Nguyen T, Kesavaraju A, Sohn LL. Node-pore sensing: a robust, high-dynamic range method for detecting biological species. Lab Chip. 2013;13(7):1302–7. 4. doi: 10.1039/c3lc41286e. [DOI] [PubMed] [Google Scholar]
- 10.Kersting K. Specific problems using electronic particle counters. Hydrobiological Bulletin. 1985;19(1):5–12. [Google Scholar]
- 11.Samyn JC, McGee JP. Count loss with the coulter counter. Journal of Pharmaceutical Sciences. 1965;54(12):1794–1799. [Google Scholar]
- 12.Javanmard M, Davis RW. Coded corrugated microfluidic sidewalls for code division multiplexing. IEEE Sensors Journal. 2013;13(5):1399–1400. [Google Scholar]
- 13.Hassan U, Bashir R. Coincidence detection of heterogeneous cell populations from whole blood with coplanar electrodes in a microfluidic impedance cytometer. Lab on a Chip. 2014;14(22):4370–4381. doi: 10.1039/c4lc00879k. [DOI] [PubMed] [Google Scholar]
- 14.Rivest FR, Pachacek AP, Pack R, Goodman K, Cho N, Lustig M, Sohn LL. Toward real-time cell detection and characterization using barker-coded node-pore sensing (nps). microTAS 2015 Conference Proceedings; Chemical and Biological Microsystems Society; 2015. pp. 47–50. [Google Scholar]
- 15.Barker RH. Group synchronizing of binary digital systems. Communication Theory. 1953:273–287. [Google Scholar]
- 16.Stallings W. Data and computer communications. Pearson/Prentice Hall; 2007. [Google Scholar]
- 17.Liu R, Wang N, Kamili F, Sarioglu AF. Microfluidic codes: a scalable multiplexed electronic sensor for orthogonal detection of particles in microfluidic channels. Lab Chip. 2016;16(8):1350–7. 4. doi: 10.1039/c6lc00209a. [DOI] [PubMed] [Google Scholar]
- 18.Patel P, Holtzman J. Analysis of a simple successive interference cancellation scheme in a ds/cdma system. IEEE journal on selected areas in communications. 1994;12(5):796–807. [Google Scholar]
- 19.Tropp JA, Gilbert AC. Signal recovery from random measurements via orthogonal matching pursuit. IEEE Transactions on information theory. 2007;53(12):4655–4666. [Google Scholar]
- 20.Richards MA. Fundamentals of radar signal processing. Tata McGraw-Hill Education; 2005. [Google Scholar]
- 21.Blake Stephen. Os-cfar theory for multiple targets and nonuniform clutter. IEEE transactions on aerospace and electronic systems. 1988;24(6):785–790. [Google Scholar]
- 22.DeBlois RW, Bean CP, Wesley RK. Electrokinetic measurements with submicron particles and pores by the resistive pulse technique. Journal of colloid and interface science. 1977;61(2):323–335. [Google Scholar]
- 23.Andersen R. Modern methods for robust regression. 152. Sage; 2008. [Google Scholar]
- 24.Daubechies I, DeVore R, Fornasier M, Güntürk CS. Iteratively reweighted least squares minimization for sparse recovery. Communications on Pure and Applied Mathematics. 2010;63(1):1–38. [Google Scholar]


