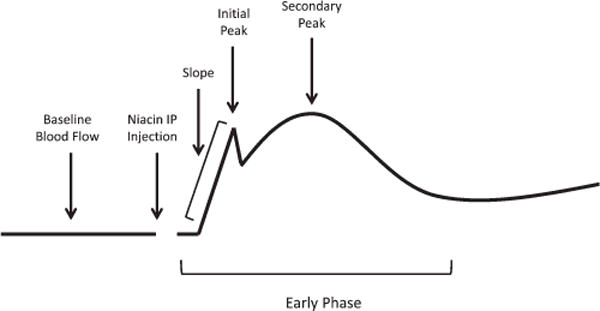
FIGURE 1.

Schematic representation of blood flow profile analysis of the “early phase” of niacin-induced vasodilation. After establishing baseline blood flow, niacin was administered by IP injection. During early phase flushing, there was an initial rapid increase in blood flow (slope) that peaked briefly (initial peak), followed by another, more prolonged peak (secondary peak).
