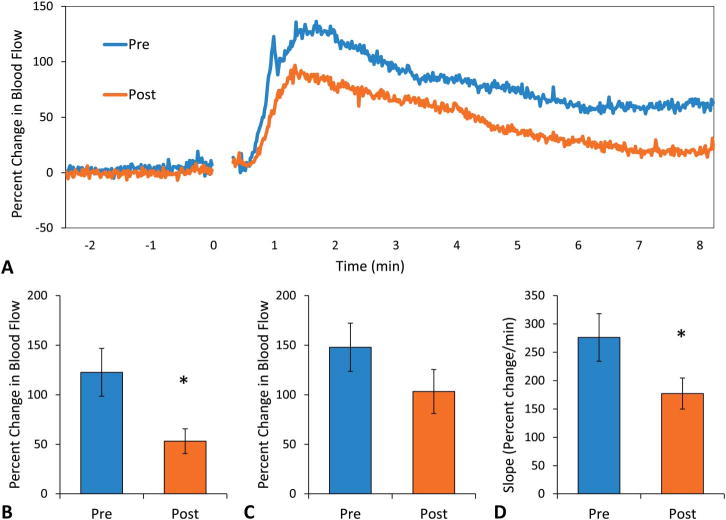
FIGURE 5.

A, Mean blood flow responses to acute niacin. Before repeated capsaicin exposure (blue, n = 9), niacin produced 2 peaks in blood flow. After repeated capsaicin exposure (orange, n = 9), there was only a secondary peak, which was lower compared with precapsaicin. B, Blood flow at the initial peak. Post-capsaicin responses lacked the initial peak and the change in blood flow at that time point was significantly reduced from 123 ± 24 to 53 ± 13 % change (*P < 0.05). C, Blood flow at the secondary peak. The secondary peak postcapsaicin was not significantly different compared with precapsaicin values (148 ± 24 to 103 ± 22 % change, P = 0.098). D, Slope of the initial change in blood flow. The postcapsaicin rate of change in blood flow was significantly reduced to 177 ± 27 from 276 ± 42 % change per minute (*P < 0.05).
