
FIGURE 9.
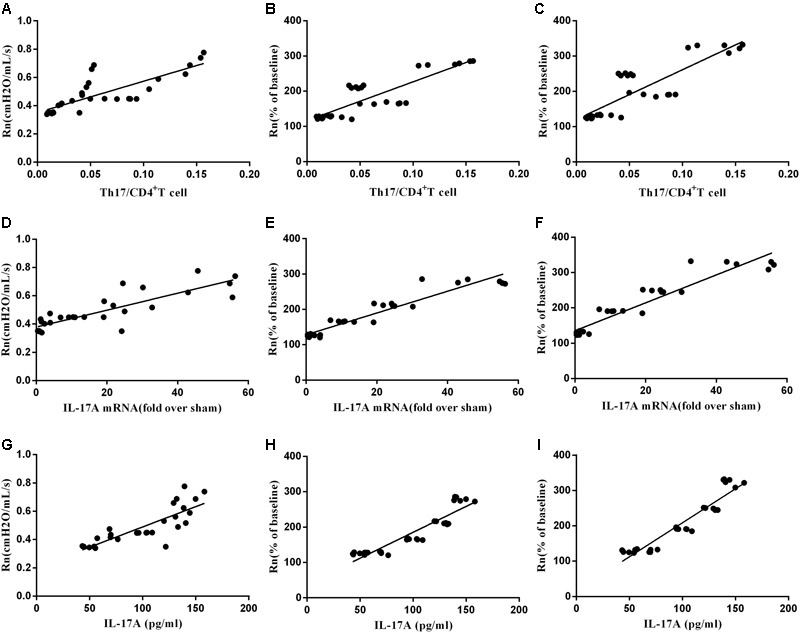
The correlation between AHR and Th17. (A) The correlation of baseline Rn andTh17/CD4+T cells (n = 30, r = 0.8401, P < 0.01). (B) The correlation of Mch (25 mg/mL) AHR and Th17/CD4+T cells (n = 30, r = 0.8189, P < 0.01). (C) The correlation of MCh (50 mg/mL) AHR and Th17/CD4+T cells (n = 30, r = 0.8363, P < 0.01). (D)The correlation of baseline Rn and IL17A mRNA (n = 30, r = 0.8408, P < 0.01). (E) The correlation of MCh (25 mg/mL) AHR and IL17A mRNA (n = 30, r = 0.8928, P < 0.01). (F) The correlation of MCh (50 mg/mL) AHR and IL17A mRNA (n = 30, r = 0.9137, P < 0.01). (G) The correlation of baseline Rn and IL-17A (n = 30, r = 0.8468, P < 0.01). (H) The correlation of MCh (25 mg/mL) AHR and IL-17A (n = 30, r = 0.9079, P < 0.01). (I) The correlation of MCh (50 mg/mL) AHR and IL-17A (n = 30, r = 0.9141, P < 0.01).