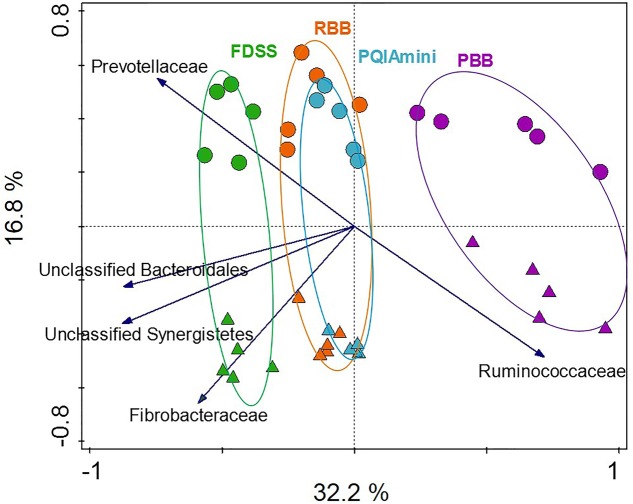
FIGURE 2.
Redundancy analysis triplot (RDA) showing the relationship between the top five family level phylogenetic groupings, the variation of which is most strongly associated with DNA extraction methods and fractions. The canonical axes are labeled with percentage of total variance explained (%). Arrow length indicates the variance explained by extraction methods and fractions. The GS100 diet has duplicate DNA extracts presented as individual datapoints.

