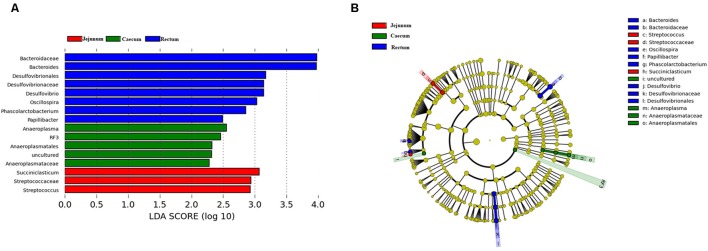
FIGURE 5.
Bacterial taxa significantly differentiated between the jejunum, caecum, and rectum samples identified by linear discriminant analysis effect size (LEfSe) using the default parameters. (A) Histogram of the LDA scores computed for bacterial taxa differentially abundant among different groups. (B) Bacterial taxa that were differentially abundant in different groups visualized using a cladogram.

