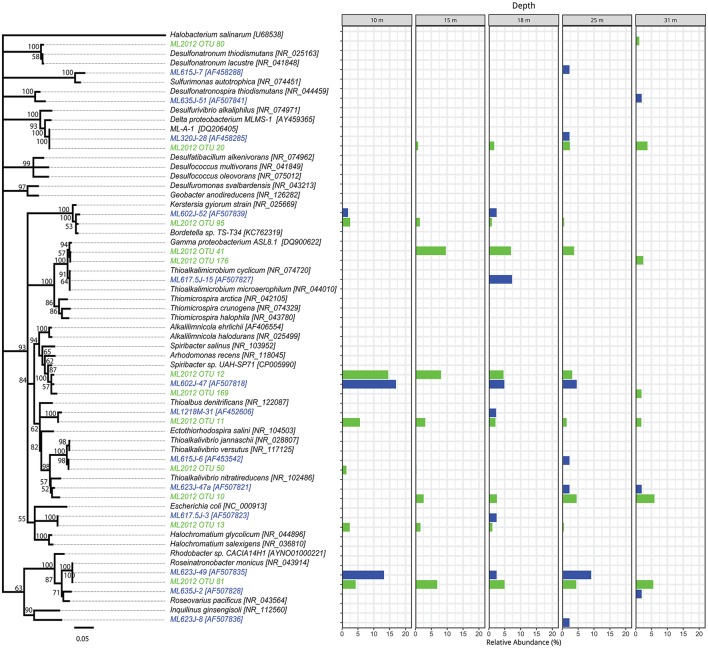
Figure 4.
Phylogenetic tree showing the relative abundance of Proteobacteria OTUs by depth. Taxa and bars shown in green represent 16S rRNA OTUs derived from tag pyrosequencing. Taxa and bars shown in blue represent 16S rRNA OTUs derived from sequences of cloned amplicons reported in Humayoun et al. (2003). Taxa shown in black represent 16S rRNA gene reference sequences for bins accounting for >1% relative abundance in the metatranscriptome from that depth (both samples combined). The outgroup is Halobacterium salinarum.

