FIGURE 2.
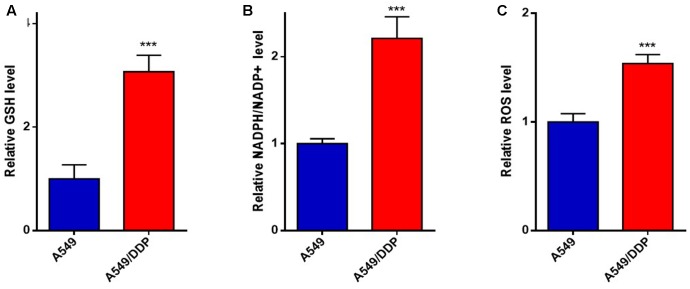
The redox status of A549/DDP cells was different from that of A549 cells. The (A) GSH, (B) NADPH/NADP+, and (C) ROS level were measured in A549 and A549/DDP cells. Data are represented as the means ± SD (n = 3), and significant differences are indicated as ∗P < 0.05, ∗∗P < 0.01, and ∗∗∗P < 0.001.

