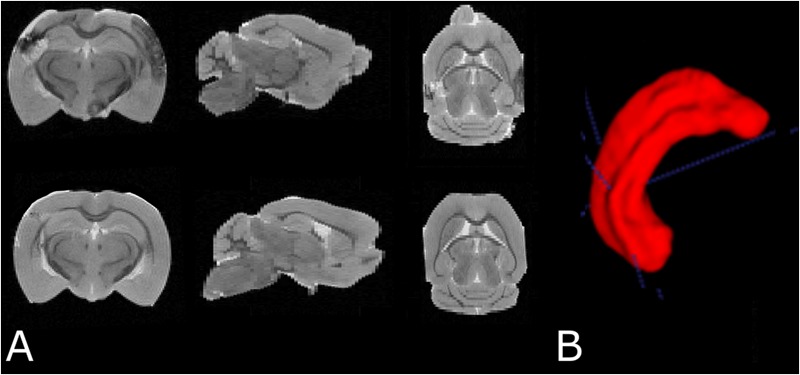
FIGURE 4.

(A) Examples of T2 weighted MRI data demonstrating slices in three orthogonal planes from the fixed brain of an SAH animal (top row) and a sham-operated animal (bottom row). (B) 3D segmentation of the left hippocampus. The cortical abnormality seen in the SAH brain is due to the contralateral pressure probe used to monitor ICP.
