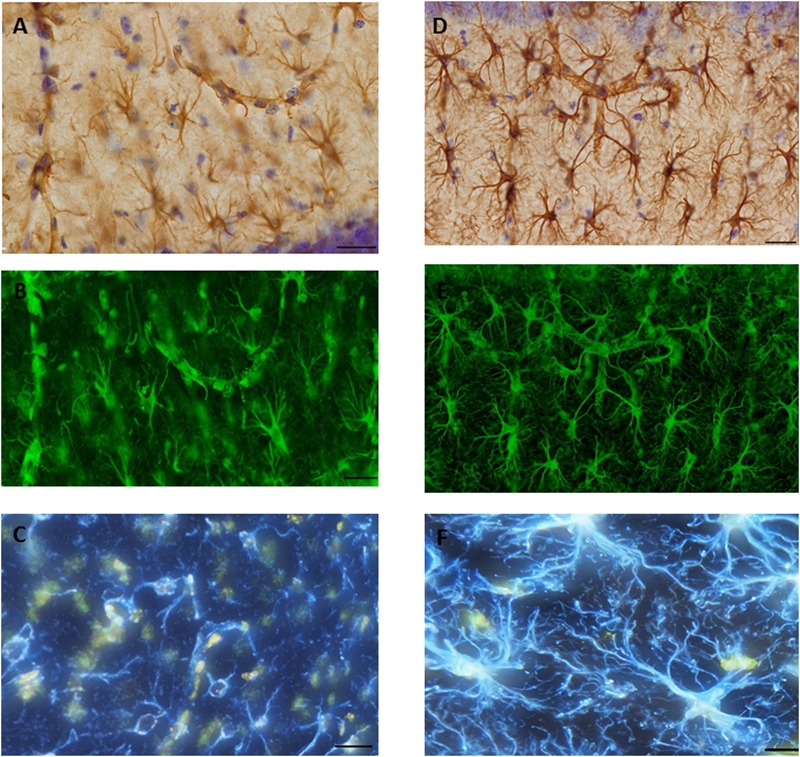
FIGURE 7.

Glial fibrillary acid protein (GFAP) immunostaining image was captured from the hippocampus of (A). SAH and (D) sham mice hippocampus using a 60× objective with ultimate resolution from light microscopy. GFAP positive astrocytes were tracked and analyzed based on the processes terminal points using Filament Tracers Algorithm in Imaris software. Tissue includes different parameters (cell soma and branches). Each channel (color) is related to one parameter, therefore selecting one channel resulted into the same (green) color for both branches and cell soma in (B). SAH and (E) sham, two channels (blue is related to the branches; yellow is related to the soma) in (C). SAH and (F) sham. Scale bar = 20 μm.
