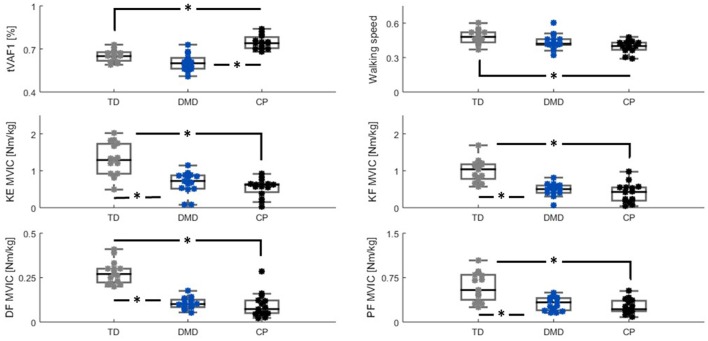
Figure 2.
Group differences (TD (gray), DMD (blue) and CP (black)) between tVAF1, walking speed, and MVIC-outcomes. Significant differences (p ≤ 0.005) based on the Mann-Whitney U-test are indicated with *. Please note the scaling on MVIC axes are not the same, due to differences in maximal net joint torque between muscle groups. CP, cerebral palsy; DMD, Duchenne muscular dystrophy; DF, dorsiflexion; KE, knee extension; KF, knee flexion; Nm/kg, Newton meter per kilogram bodyweight; MVIC, maximal voluntary isometric contraction; PF, plantar flexion; tVAF1, total variance accounted for by one synergy; TD, typical developing.

