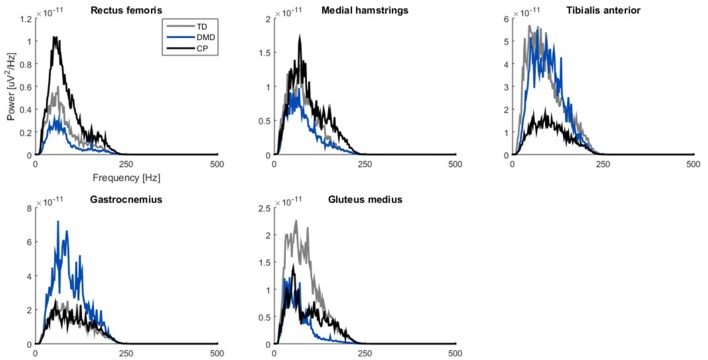
Figure 4.
Power spectrum density plots of filtered sEMG signals (20–450 Hz). Median curves are plotted for each group: TD (gray), DMD (blue) and CP (black). Please note the scaling of the axes is not the same, due to differences between muscles. CP, cerebral palsy; DMD, Duchenne muscular dystrophy; Hz, Herz; TD, typical developing; μV, microvolts.

