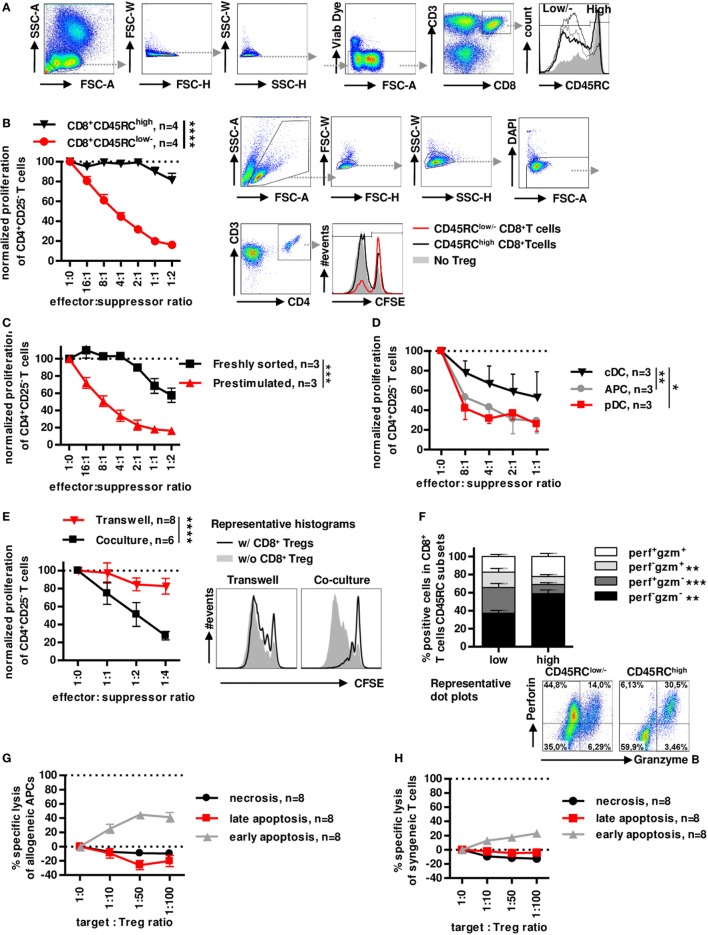
Figure 1.
Low expression of CD45RC in CD8+ T cells positively correlates with suppressive activity, but not cytotoxicity. PBMCs from healthy volunteers were analyzed for the phenotype of CD8+ Tregs. (A) CD8+ Tregs were defined by gating on lymphocytes morphology, FSC and SSC singlets, living cells, CD3 and CD8 double positive cells, and CD45RClow/− cells including negative and intermediate expression of CD45RC marker. Far right: histogram represents overlay of CD45RC expression by four healthy volunteers. (B) CD8+CD45RClow/− T cells (red lines) and CD8+CD45RChigh T cells (black line) from fresh PBMCs of healthy volunteers were sorted and stimulated overnight with anti-CD3 and anti-CD28 MAbs and tested for suppressive activity on proliferation of syngeneic CD4+CD25− T cells stimulated with allogeneic APCs, in a range of effector:suppressor ratio. Proliferation was normalized to proliferation in the absence of Tregs. Two-way row-matched (RM) ANOVA, n = 4 for each group, ****p < 0.0001. Representative histograms of T CD4+ responder cell proliferation in the presence of CD8+CD45RClow/− (red line) and CD8+CD45RChigh (black line) T cells or without CD8+ T cells (filled gray), after gating on morphology, excluding doublet cells, and gating on living CD4+ T cells. (C) CD8+CD45RClow/− T cells from fresh PBMCs of healthy volunteers were sorted and stimulated overnight with anti-CD3 and anti-CD28 MAbs (red lines) or not (black line) and tested for suppressive activity on proliferation of syngeneic CD4+CD25− T cells stimulated with allogeneic APCs, in a range of effector:suppressor ratio. Proliferation was normalized to proliferation in the absence of Tregs. Two-way RM ANOVA, n = 3 for each group, ***p < 0.001. (D) Plasmacytoid dendritic cells (pDCs), conventional dendritic cells (cDCs), and total APCs were compared as stimulator cells for suppressive activity of Tregs. Proliferation was normalized to proliferation in the absence of Tregs. Two-way RM ANOVA, n = 3, *p < 0.05, **p < 0.01. (E) CD8+CD45RClow/− Tregs were sorted, stimulated overnight with anti-CD3 and anti-CD28 MAbs, and compared for suppressive activity when physically separated from responder cells by a 0.4 µm transwell membrane (transwell, n = 8) vs. in contact with responder cells (coculture, n = 6). Proliferation was normalized to proliferation in the absence of Tregs with or without transwell membrane. APCs were added in both compartments. Two-way RM ANOVA, ****p < 0.0001. (F) CD45RClow/− and high CD8+T cells were compared for granzyme and perforin expression after PMA-ionomycine stimulation. Wilcoxon matched-pairs signed rank test two-tailed, n = 15, **p < 0.01, ***p < 0.001. Bottom: Representative dot plots of perforin and granzyme expression in CD45RClow/− (left) and CD45RChigh (right) CD8+ T cells. (G) CD8+CD45RClow/− Tregs were tested for specific lysis of allogeneic APCs in a range of target:Tregs ratio. Necrosis (black line) and late (red line) and early (gray line) apoptosis were defined by annexin V and Dapi labeling after 15 h of coculture. n = 8. (H) CD8+CD45RClow/− Tregs were tested for specific lysis of syngeneic CD4+CD25− T cells in a range of target:Tregs ratio. Necrosis (black line) and late (red line) and early (gray line) apoptosis were defined by Annexin V and Dapi labeling after 15 h of coculture. n = 8.

