
Figure 4.
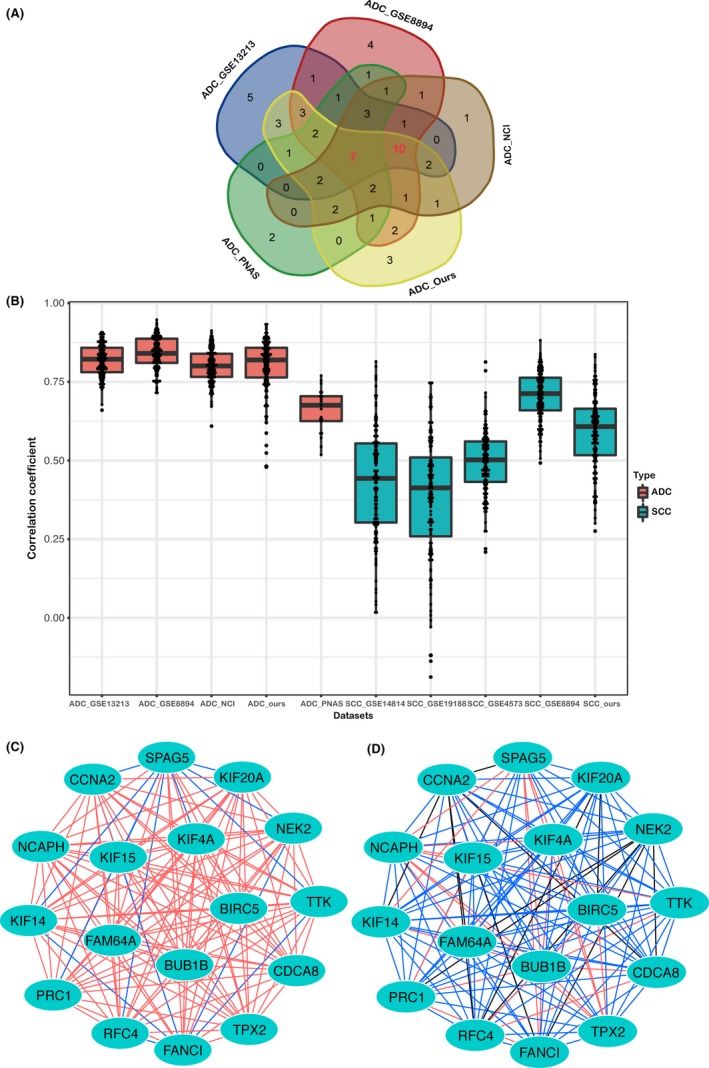
Characteristics of core genes in lung adenocarcinoma (ADC_Ours) and squamous cell carcinoma (SCC_Ours) datasets, containing gene expression data from 69 lung ADC samples and 69 lung SCC samples, respectively. A, The Venn diagram displays the overlap of the core genes of 5 independent lung ADC datasets. Each dataset is colored, and the numbers indicate the number of overlapping genes. B, The difference in the correlation coefficients of 17 core genes between the lung ADC and SCC datasets. The correlation coefficients of the 17 core genes in the lung ADC datasets are higher than those in the lung SCC datasets; 2‐way ANOVA was used to determine the significant difference (P < .0001). (C, D) Protein‐protein interaction networks of associated proteins encoded by the 17 core genes in the lung ADC_Ours and SCC_Ours datasets. The nodes represent core genes, and the edges represent correlation coefficients, the colors of the edges represent the r value from the correlation test. Red edges represent an r value ≥.7 and <1; blue edges represent an r value ≥.4 and <.7; black edges represent an r value >0 and <.4. The 17 proteins clearly interact more strongly with each other in the lung ADC_Ours dataset (C) than in the lung SCC_Ours dataset (D)