
Figure 4. Power and robustness.
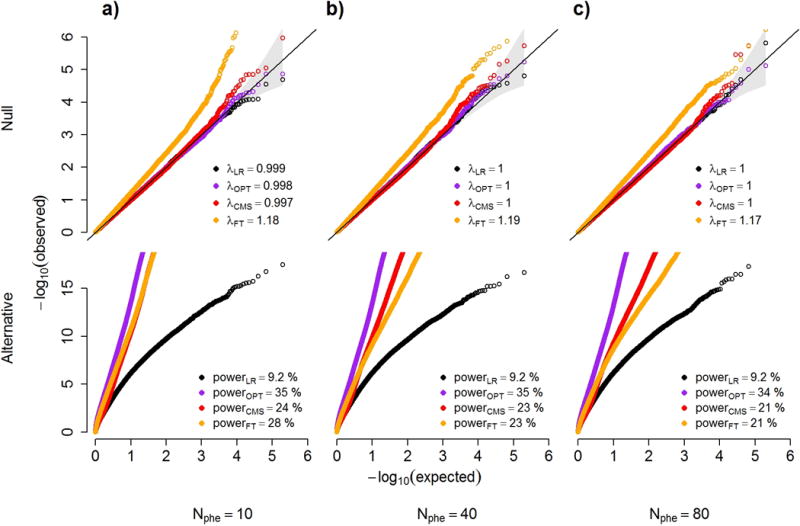
QQ plots under the null and alternate distributions of p-values from a series of simulations. We compare four statistical tests: a standard marginal univariate test (LR); the optimally adjusted test (OPT) that includes as covariates only the outcomes not associated with the predictor; CMS; and a univariate test that include as covariate all outcomes with a p-value for association with the predictor above 0.1 (FT). Grey boxes show the genomic inflation factor for the null models (upper panels), and estimated power at an α threshold of 5×10⁻⁷ (to correct for 100,000 tests) for the alternative model (lower panels). Null models also include the 95% confidence interval of the −log10(p-values), displayed as a grey cone around the diagonal. Simulations were taken from 100,000 datasets including 10 (a), 40 (b) and 80 (c) outcomes under a null model (upper panels), where a predictor of interest is not associated with a primary outcome but is associated with either 0%, 15% or 35% of the other outcomes with probability 0.75, 0.2 and 0.05 respectively, and under the alternative (lower panels), where the predictor is associated with the primary outcome only. The variance of the primary outcome that can be explained by the other outcomes was randomly chosen from [25%, 50%, 75%] with equal probability.