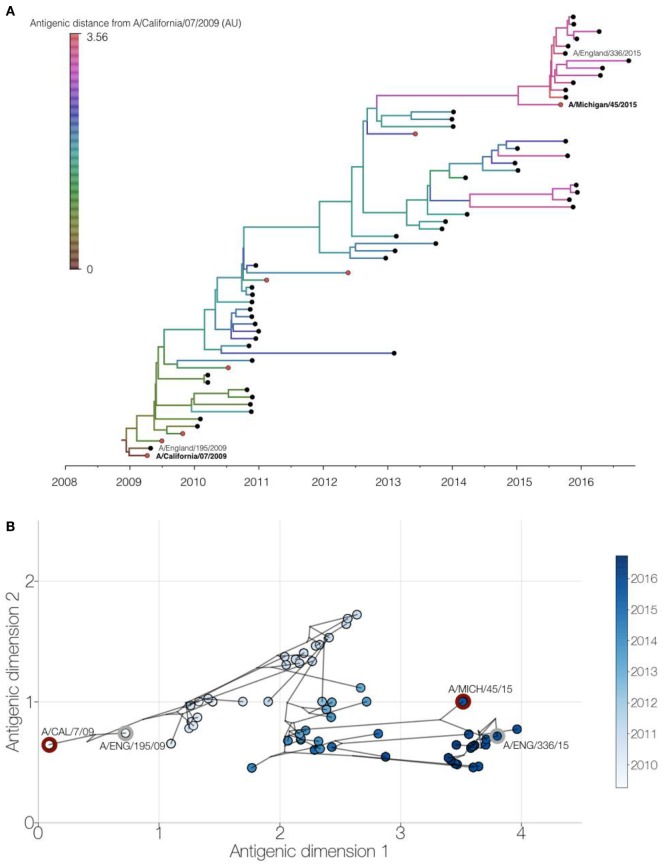
Figure 4.
Genetic and antigenic drift of H1N1pdm09 strains between 2009 and 2016. Integrated phylogenetic and antigenic cartography analysis of 61 viruses using Bayesian multidimensional scaling (14). (A) Time-resolved phylogenetic tree of viruses circulating in England (black circles) and WHO reference viruses (red circles) with branches colored by inferred antigenic difference from A/California/07/2009 vaccine strain in antigenic map units. Study viruses are shown with text and vaccine virus names in bold. (B) Two-dimensional antigenic map showing antigenic (circles, colored by virus collection date) and phylogenetic relationships (lines) of viruses. Distances for antigenic dimensions are measured in antigenic units, where one unit represents a twofold dilution in heterologous hemagglutination inhibition titer. Study viruses (gray outline) and vaccine viruses (red outline) are highlighted.

