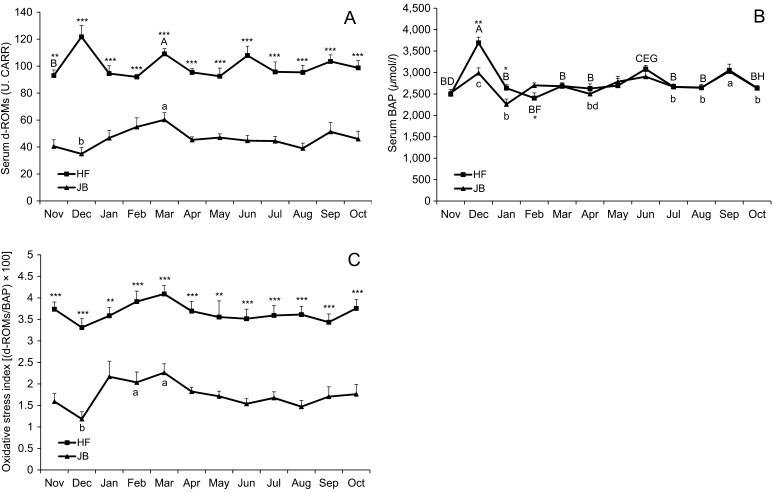
Fig. 3.
(A) Mean values (± SE) of serum d-ROMs, (B) BAP and (C) oxidative stress index [(d-ROMs/BAP) × 100] in HF and JB cows pastured during the daytime from November 2013 to October 2014. Values with different letters are significantly different (A–B, C–D, E–F, G–H; P<0.05) and (a–b, c–d; P<0.05) for HF and JB cows, respectively. *, **, *** Significantly differs from the value in JB cows within a sampling period at P<0.05, P<0.01 and P<0.001, respectively.

