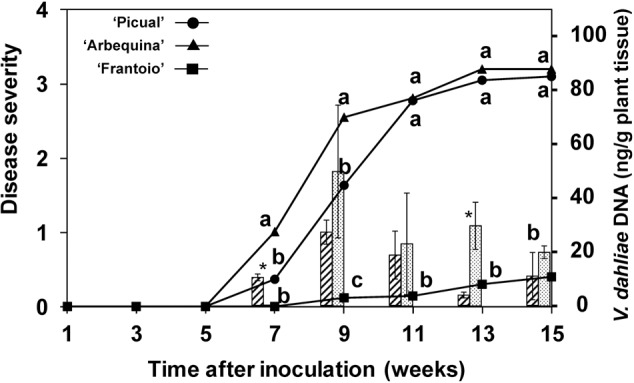
FIGURE 4.

Progress of disease severity and amount of V. dahliae DNA in plants of ‘Picual,’ ‘Arbequina,’ and ‘Frantoio’ cultivars inoculated with V. dahliae (experiment of artificial inoculation). The disease severity values are the means of 14 replicates in each week according to a 0-to-4 scale. Columns represent the average amount of V. dahliae DNA in three sampled plants (hatched columns for “Arbequina’ and pointed columns for ‘Picual’). Different letters indicate significant differences in disease severity according to a non-parametric Kruskal–Wallis test at P = 0.05. An asterisk indicates significant difference in the amount of DNA between ‘Arbequina’ and ‘Picual’ according to according to Fisher’s protected LSD test at P = 0.05. Bars represent the mean (±) standard errors.
