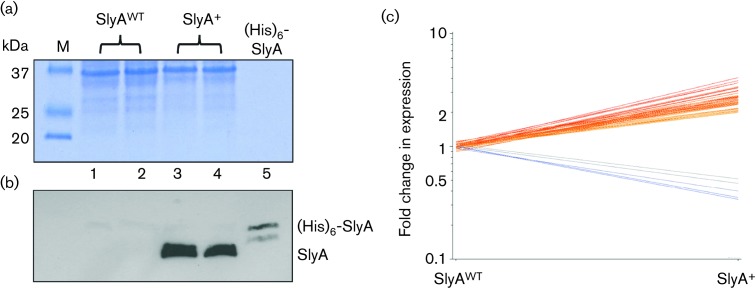
Fig. 1.
Changes in the transcript profile of E. coli K-12 MG1655 over-producing SlyA. Transformation of E. coli K-12 MG1655 with a multi-copy plasmid expressing slyA under the control of its own promoter results in detectable SlyA protein in lysed cell suspensions from aerobic steady-state glucose-limited chemostat cultures. The upper panel (a) shows the Coomassie blue-stained SDS-polyacrylamide gel and the lower panel (b) shows the relevant region of a Western blot prepared with the same samples and loadings developed with SlyA antiserum. The gels were loaded as follows: lane M, SDS-PAGE markers (sizes, kDa, are indicated); lanes 1 and 2, extracts from independent cultures of E. coli K-12 MG1655 transformed with the vector pET28a (SlyAWT); lanes 3 and 4, extracts from independent cultures of E. coli K-12 MG1655 transformed with the expression plasmid pGS2468 (SlyA+); lane 5, purified (His)6-SlyA (~10 ng protein loaded). (b) Western blot corresponding to the gel shown in (a). The locations of SlyA and purified (His)6-SlyA are indicated. (c) Graphical representation of the changes in transcript abundance occurring upon over-production of SlyA in E. coli K-12 MG1655. Comparison of the fold changes in transcript abundance of aerobic steady-state glucose-limited chemostat cultures of E. coli K-12 MG1655 transformed with either pET28a (SlyAWT) or pGS2468 (SlyA+). Each line represents a gene that exhibits a ≥2-fold change in transcript abundance (P≤0.05) from two biological and two technical replicates, i.e. four measurements.

