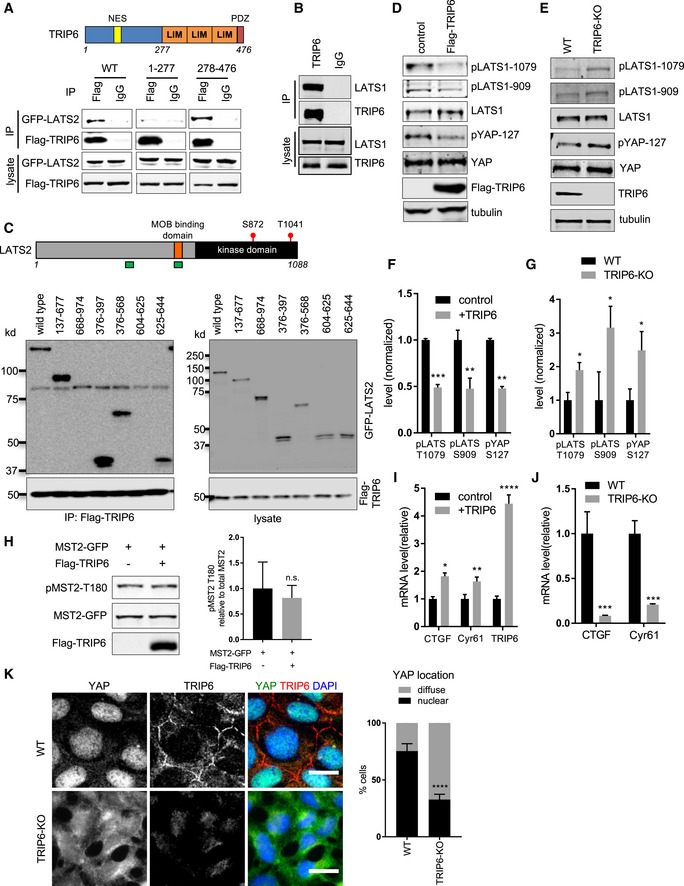
Full‐length (WT), the amino‐terminal half (1–277), or the carboxy‐terminal half (278–476) of TRIP6 were tested for binding to LATS2 by immunoprecipitation. FLAG‐TRIP6 variants were co‐expressed with LATS2‐GFP in HEK293 cells; anti‐FLAG or control (IgG) antibodies were used to isolate immune complexes. Immune complexes and lysates were probed by Western blotting for LATS2‐GFP and FLAG‐TRIP6. Schematic diagram depicts TRIP6 domains (NES: nuclear export signal; LIM: LIM domain; PDZ: PDZ domain binding motif).
Lysates from MCF10A cells were subjected to immunoprecipitation using anti‐TRIP6 or control (IgG) antibodies, and immune complexes and lysates were probed for TRIP6 and LATS1.
FLAG‐TRIP6 was tested for binding to various LATS2‐GFP deletion mutants as described in part (A). Schematic diagram of LATS2 shows MOB1 binding domain, and the autophosphorylation (S872) and MST1/2 phosphorylation sites (T1041) in the kinase domain. The regions marked in green depict TRIP6 binding sites on LATS2.
Lysates from HEK293A cells transfected with control or FLAG‐TRIP6 plasmid were analyzed by Western blotting using the indicated antibodies (quantification is shown in panel F).
Lysates from control (WT) or CRISPR generated TRIP6 null (TRIP6‐KO) HEK293A cells were analyzed by Western blotting using the indicated antibodies (quantification shown in panel G).
The relative levels of LATS1 activating phosphorylation (pLATS1‐1079, 909) and YAP S127 inhibitory phosphorylation from (D) were measured relative to LATS1 and YAP levels, respectively (mean ± SD; n = 3; **P ≤ 0.01, ***P ≤ 0.001, t‐test).
The levels of LATS1 activating phosphorylation and YAP inactivating phosphorylation from part (E) were quantified (mean ± SD; n = 3; *P ≤ 0.05, t‐test).
GFP‐MST2 was expressed with or without FLAG‐TRIP6 in HEK293 cells, and the levels of MST2, MST2 activating phosphorylation (pMST2‐T180), and FLAG‐TRIP6 were measured by Western blotting with the indicated antibodies (mean ± SD; n = 3; n.s. ≥ 0.05, t‐test).
TRIP6 was overexpressed in HEK293A cells, and the levels of TRIP6 and YAP target gene expression were analyzed using RT–qPCR (mean ± SD; n = 3; *P ≤ 0.05, **P ≤ 0.01, ****P ≤ 0.0001, t‐test).
The levels of YAP target gene expression were analyzed using RT–qPCR in control (WT) and TRIP6‐KO HEK293A cells (mean ± SD; n = 3; ***P ≤ 0.001, t‐test).
Control (WT) and TRIP6‐KO HEK293A cells were stained for YAP and TRIP6. Merged image shows YAP (green), TRIP6 (red), and DNA (blue). Quantification of at least 100 cells is shown (mean ± SD; n = 3; ****P ≤ 0.0001, Fisher's test). Scale bar = 20 μm.