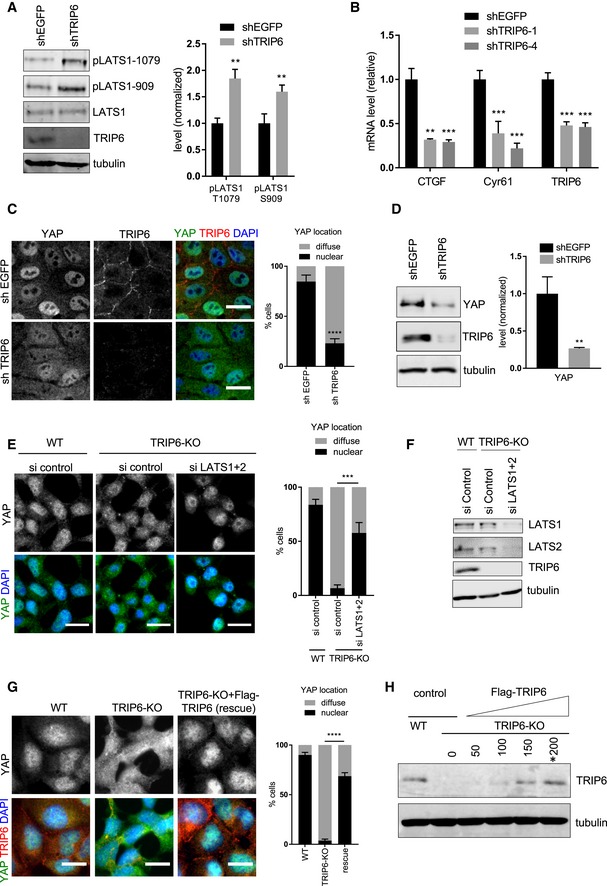
Lysates from MCF10A cells infected with lentivirus with a control shRNA (shEGFP) or a mix of two different shRNA against TRIP6 (shTRIP6‐1 and shTRIP6‐4) were analyzed by Western blotting using the indicated antibodies, and the levels of LATS1 activating phosphorylation were quantified (mean ± SD; n = 3; **P ≤ 0.01, t‐test).
MCF10A cells were infected with lentivirus carrying control shRNA (shEGFP), or two different shRNA against TRIP6 (shTRIP6‐1, shTRIP6‐4) and the levels of TRIP6 and YAP target gene expression were analyzed using RT–qPCR (mean ± SD; n = 3; **P ≤ 0.01, ***P ≤ 0.001, t‐test).
MCF10A cells were infected with lentivirus carrying control shRNA (shEGFP), or a mix of two different shRNA against TRIP6 (shTRIP6‐1 and shTRIP6‐4) and were stained for YAP and TRIP6. Merged image shows YAP (green), TRIP6 (red), and DNA (blue). Quantification of YAP nuclear localization in least 100 cells is shown (mean ± SD; n = 3; ****P ≤ 0.0001, Fisher's test). Scale bar = 20 μm.
YAP, TRIP6, and tubulin levels were measured by Western blotting in MCF10A cells infected with lentivirus carrying control shRNA (shEGFP), or shRNA against TRIP6 (shTRIP6‐1) (mean ± SD; n = 3; **P ≤ 0.01, t‐test).
LATS1 and LATS2 were depleted from WT and TRIP6‐KO 293A cells using siRNA as described (Fig
3B) and were stained for YAP. Merged image shows YAP (green) and DNA (blue). Quantification of YAP nuclear localization in least 100 cells is shown (mean ± SD;
n = 3; ***
P ≤ 0.001, Fisher's test). Scale bar = 20 μm.
The lysates from (E) were probed by Western blotting with LATS1, LATS2, TRIP6, and tubulin antibodies to test knockdown efficacy.
Control (WT) and TRIP6‐KO HEK293A cells were transfected with 200 ng of control and FLAG‐TRIP6 plasmids. (Note that 200 ng of FLAG‐TRIP6 plasmid restores approximate wild‐type levels (see panel H) of TRIP6 expression). After 48 h of transfection, cells were stained using anti‐YAP and TRIP6 antibodies by immunofluorescence. Quantification of YAP nuclear localization is shown (mean ± SD; n = 3; ****P ≤ 0.0001, Fisher's test). Scale bar = 20 μm. We compare TRIP6‐KO cells to TRIP6‐KO cells rescued by FLAG‐TRIP6 plasmid (rescue).
Different amounts (50, 100, 150, 200 ng) of FLAG‐TRIP6 plasmid were transfected into HEK293A TRIP6‐KO cells and TRIP6 levels in lysates were analyzed by Western blotting using anti‐TRIP6 antibodies and compared to those in control HEK293A (WT) cells. 200 ng of FLAG‐TRIP6 plasmid (marked with asterisk) was selected to perform the rescue experiment described in panel (G).