
Figure 4. Perturbations of junctions and f‐actin reduce TRIP6‐LATS1 binding and localization to cell–cell junctions.
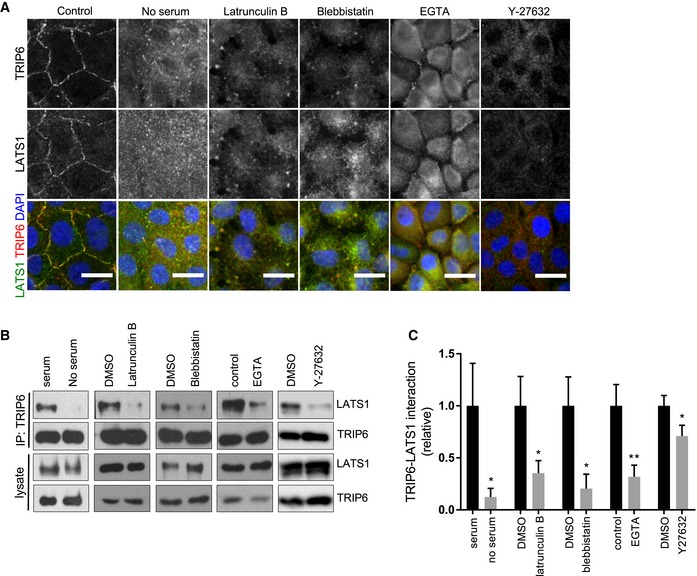
- MCF10A cells were either not treated or treated separately with Latrunculin B, Blebbistatin, EGTA, serum starvation, and Y27632 and were stained for TRIP6 and LATS1. Merged images show LATS1 (green), TRIP6 (red), and DNA (blue). Scale bar = 20 μm.
- Cells were treated as in (A) and then lysed, and anti‐TRIP6 antibodies were used to isolate immune complexes. Immune complexes and lysates were probed by Western blotting for LATS1 and TRIP6.
- Quantification of (B) is shown (mean ± SD; n = 3; *P ≤ 0.05, **P ≤ 0.01, t‐test).